Home › Blog › Quant Research
Negative Gamma, Bigger Moves: What 24 Years of SPX Dealer Gamma Say About Volatility
When options dealers were short gamma, the S&P 500 moved more than twice as much the next day. Comparing daily SPX gamma exposure (GEX), computed from closing option chains since 2002, with the next day's return shows that the sign of GEX alone separates two volatility regimes, even among days with the same VIX. I also tested what that difference does for trading, and what it does not do.
Why look at GEX
GEX estimates how much options dealers must buy or sell to stay delta-hedged when the index moves 1%. When dealers are long gamma (positive GEX), they sell into rallies and buy dips, damping moves. When they are short gamma (negative GEX), they buy strength and sell weakness, amplifying moves. The theory is clear. The questions are how large the difference is in real data, and what GEX adds to what the VIX already tells you.
Data
- Period: February 8, 2002 to October 23, 2026. Net GEX is computed every day from the closing SPX option chain, assuming dealers are long calls and short puts.
- Scaling: the options market grew many times over 24 years, so dollar GEX is not comparable across eras. I use net GEX as a percentage of that day's gross gamma (the sum of absolute call and put gamma): −100% is entirely short gamma, +100% entirely long.
- Timing: GEX at the close of day t is paired with the return from the close of t to the close of t+1. The open interest used for GEX is known before the open of t+1.
1. The scatter: the cloud widens below zero
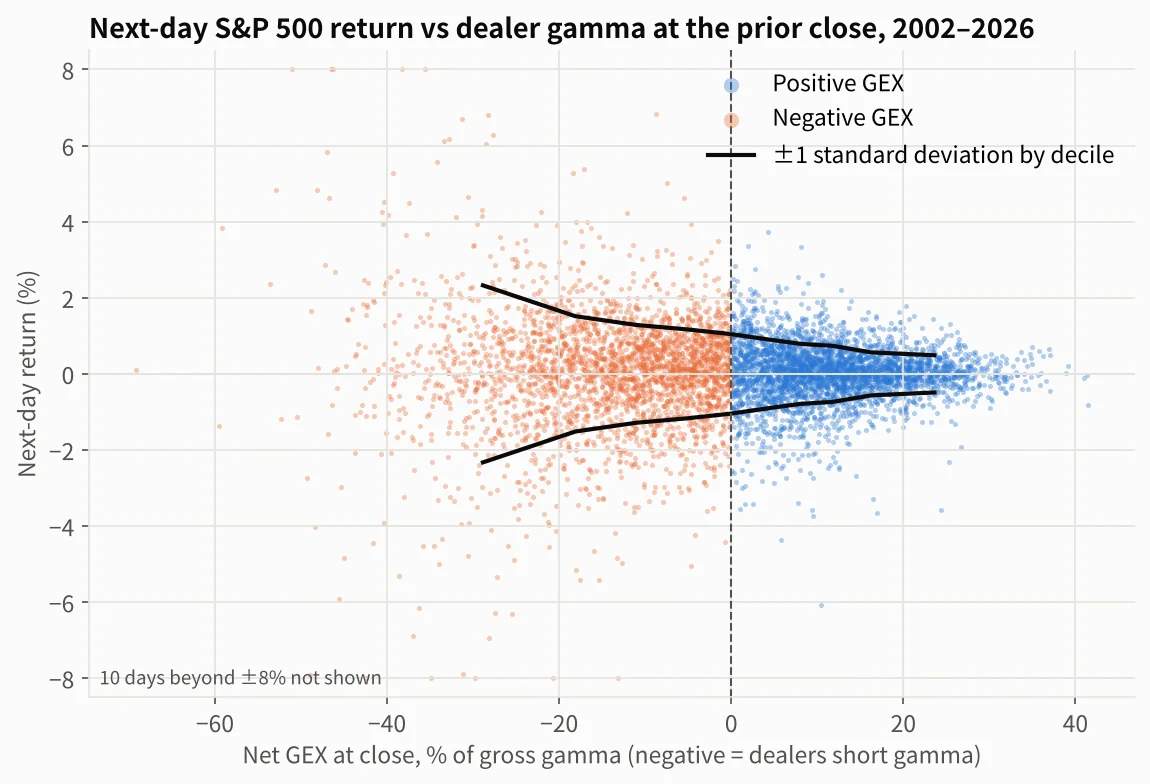
The average is close to zero on both sides; the spread is not. The 3,404 sessions with positive net GEX were followed by annualized volatility of 11.9%. The 2,801 sessions with negative GEX were followed by 25.1%. The share of days with a move larger than ±2% rose from 2.3% to 13.4%, almost six times as often.
Direction is the trap. Negative gamma is not a bearish signal. Down days beyond 2% rose from 1.6% to 7.1%, but up days beyond 2% also rose, from 0.7% to 6.3%, and the average next-day return was actually higher after negative GEX (12.0% vs 4.5% annualized), because the sharpest rebounds happen in short-gamma regimes too. Negative GEX says "bigger moves", not "lower prices".
2. By decile, the change is a staircase
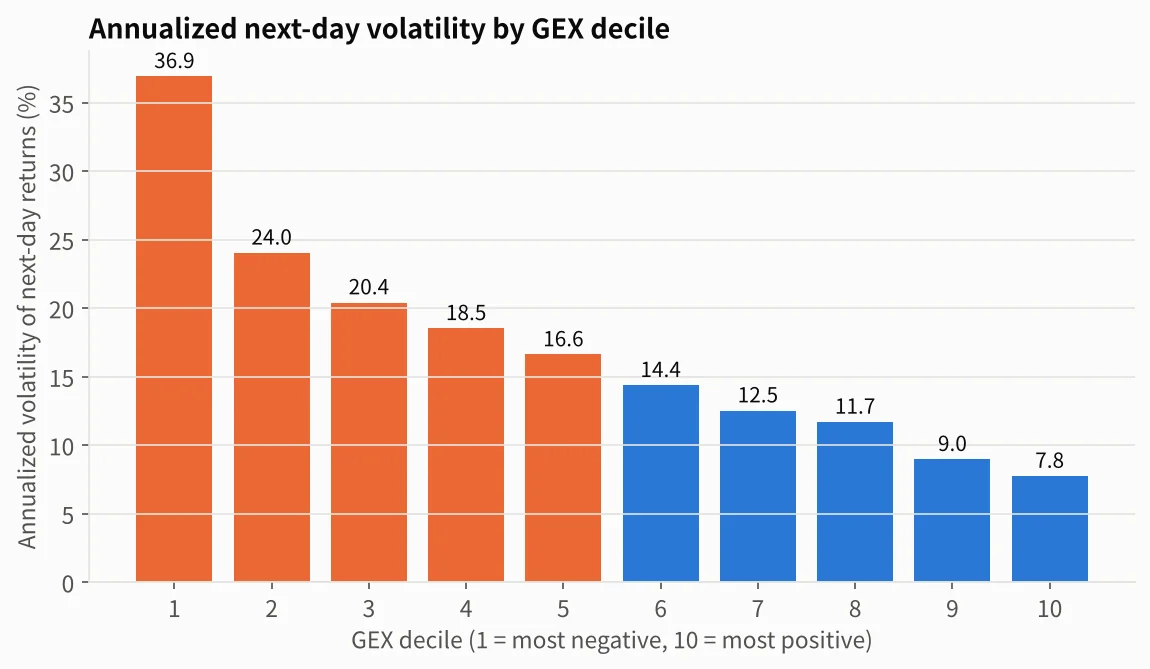
The most negative tenth of days was followed by 36.9% volatility and the most positive tenth by 7.8%, a ratio of about 4.7. Every decile in between falls in order, so the result does not hinge on one threshold.
3. Twenty-four years of GEX and the index
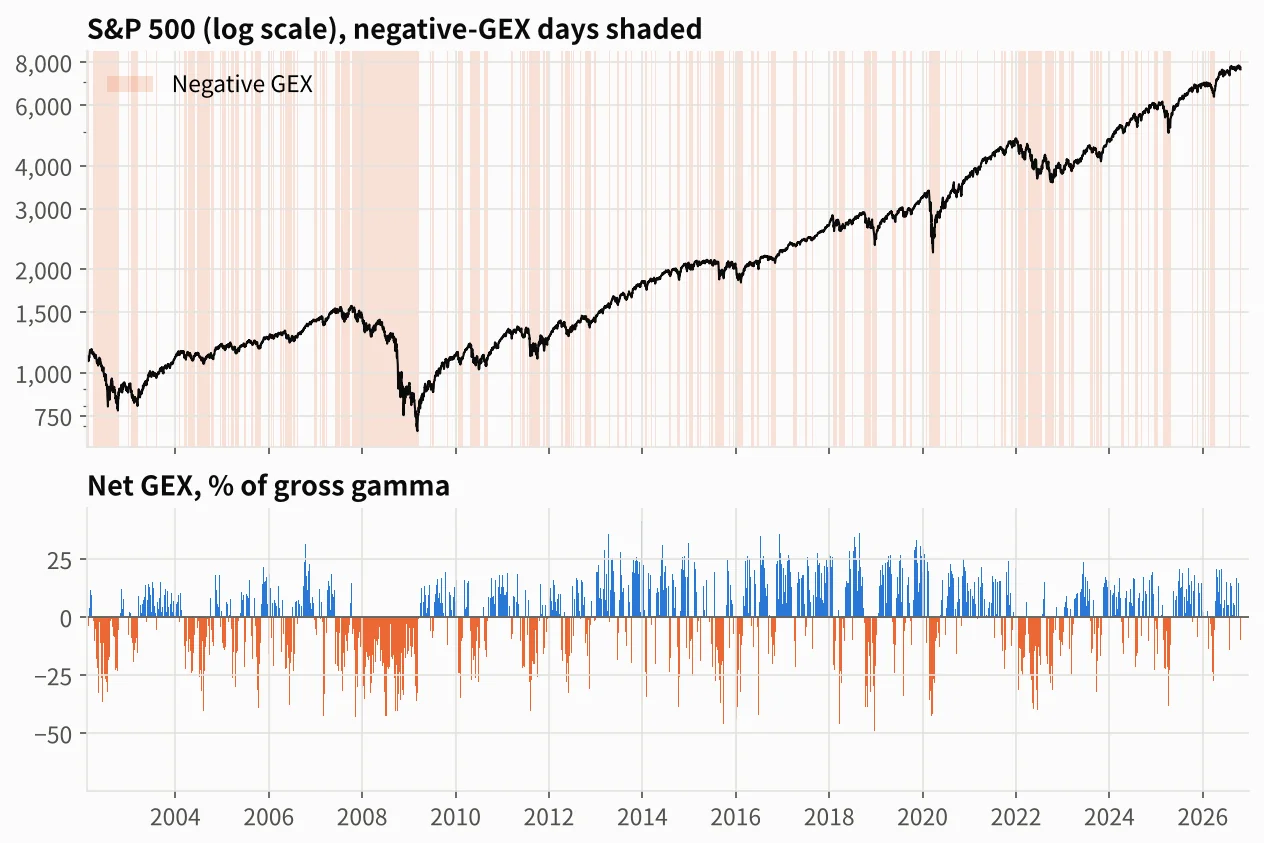
Negative gamma clusters in the large drawdowns. Every session of 2008 closed with negative GEX, and from May 7, 2008 to March 17, 2009 it stayed negative for 217 straight sessions. In the 2022 bear market 82% of sessions were negative. Quiet years such as 2013, 2017 and 2021 had only 19–27% negative days. Regimes persist: once the sign is set, it lasts seven to nine sessions on average.
The result holds in every sub-period. Next-day volatility after negative versus positive GEX was 26.1% vs 12.1% in 2002–08, 24.3% vs 13.1% in 2009–14, 18.8% vs 8.9% in 2015–19 and 27.9% vs 12.4% in 2020–26.
4. Isn't this just the VIX?
Negative-GEX days also have a higher VIX (median 20.6 vs 15.1), so GEX could simply be a copy of the VIX. Splitting each VIX range by the sign of GEX answers the question.
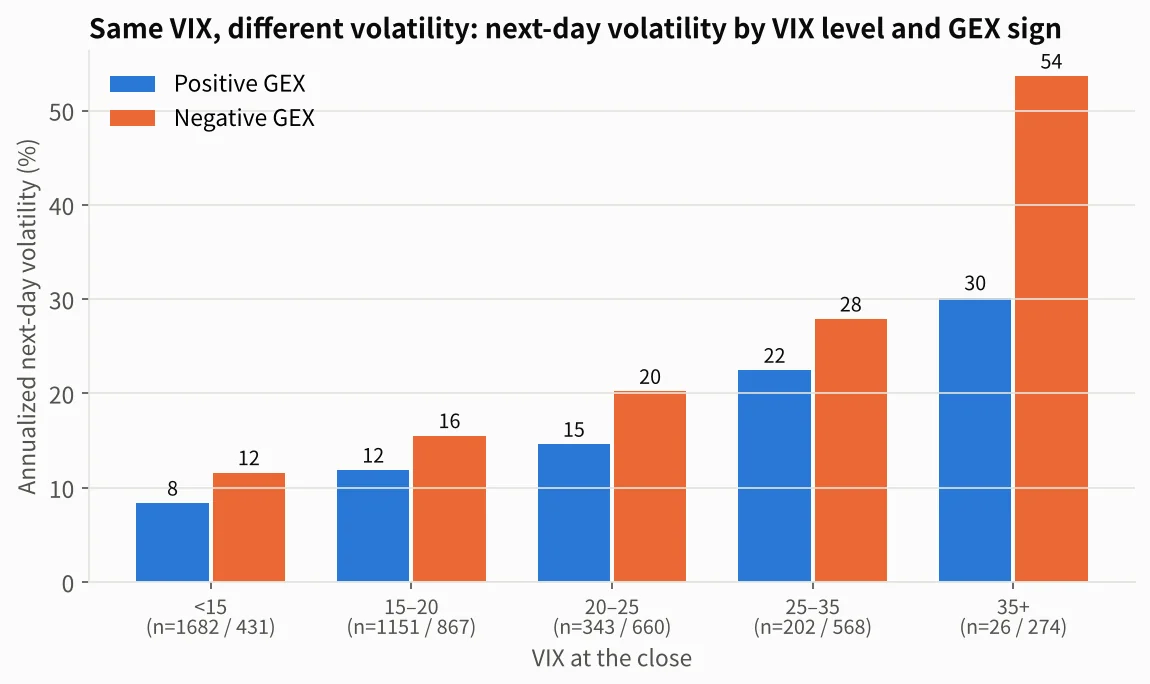
In every VIX range, negative GEX was followed by higher volatility: 8% vs 12% with VIX below 15, and 15% vs 20% with VIX between 20 and 25. A regression says the same. Adding GEX to a model that forecasts the next five days of realized volatility from the VIX and recent realized volatility improves the forecast.
| Forecasting next-5-day realized vol (log) | R² | Mean error (vol pts) |
|---|---|---|
| VIX + recent realized vol | 0.511 | 4.67 |
| + sign of GEX | 0.545 | 4.53 |
| + size of GEX (% of gross gamma) | 0.567 | 4.41 |
Out of sample: from 2005, each year is forecast with a model fitted only on earlier years. In a full-sample regression the t-statistic is 11.7 for the GEX sign and −14.3 for GEX size.
5. In trading: a filter for selling premium
Volatility selling is where GEX fits best. As a simple test, sell one day of variance at the VIX level at each close: the daily P&L is VIX²/252 minus the square of the next day's return. Compare doing it every day with doing it only when GEX is zero or positive.
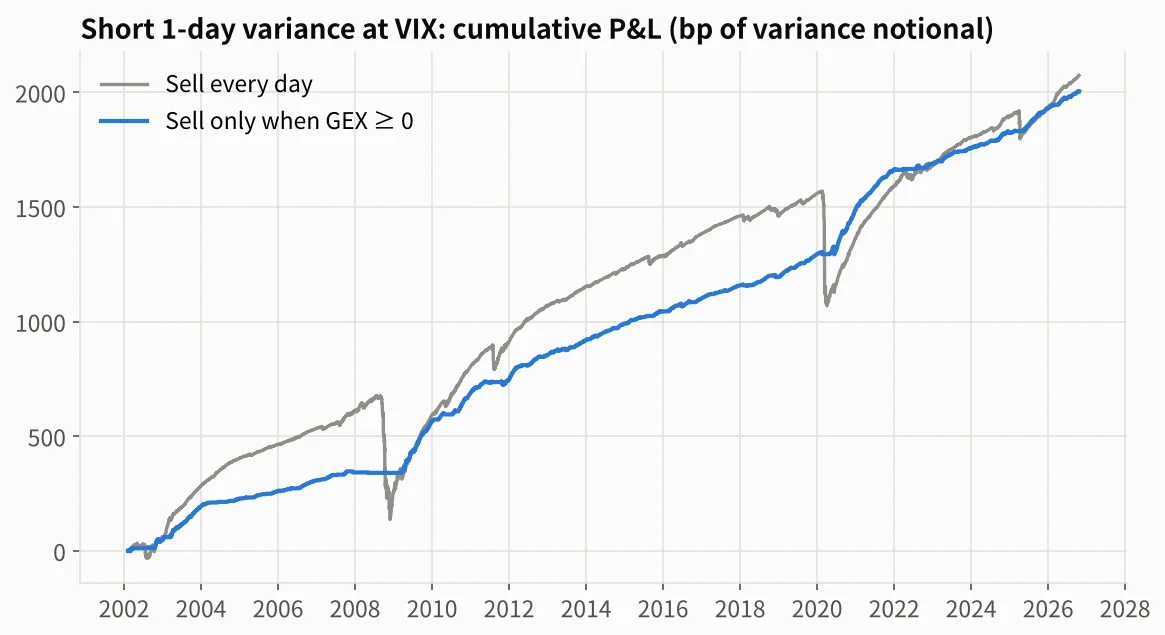
| Selling 1-day variance, 2002–2026 | Avg per day (bp) | Sharpe | Max drawdown (bp) | Worst day (bp) |
|---|---|---|---|---|
| Every day | 0.33 | 1.2 | −542 | −150 |
| Only when GEX ≥ 0 | 0.32 | 5.0 | −34 | −34 |
| Only when VIX < 18 | 0.22 | 5.0 | −20 | −16 |
Selling only on non-negative GEX days kept almost all of the premium and avoided most of the 2008 and 2020 losses, because on short-gamma days the premium barely covered the risk. Selling only when the VIX is low cuts risk by a similar amount but gives up a third of the premium. Within the same VIX range, the daily premium on positive-GEX days was two to four times larger than on negative-GEX days (with VIX between 20 and 25, 1.11 bp vs 0.36 bp).
This is an approximation that compares 30-day implied volatility (the VIX) with one-day realized volatility. It leaves out trading costs, the term-structure mismatch and the hedging costs of a real instrument, so absolute figures such as the Sharpe ratio are overstated. The point is the difference between two strategies measured the same way.
6. Stock exposure: less risk, not more return
I also tested holding the S&P 500 and cutting exposure to 50% when GEX is negative. The signal is GEX at the close of day t, and the trade is delayed to the close of t+1.
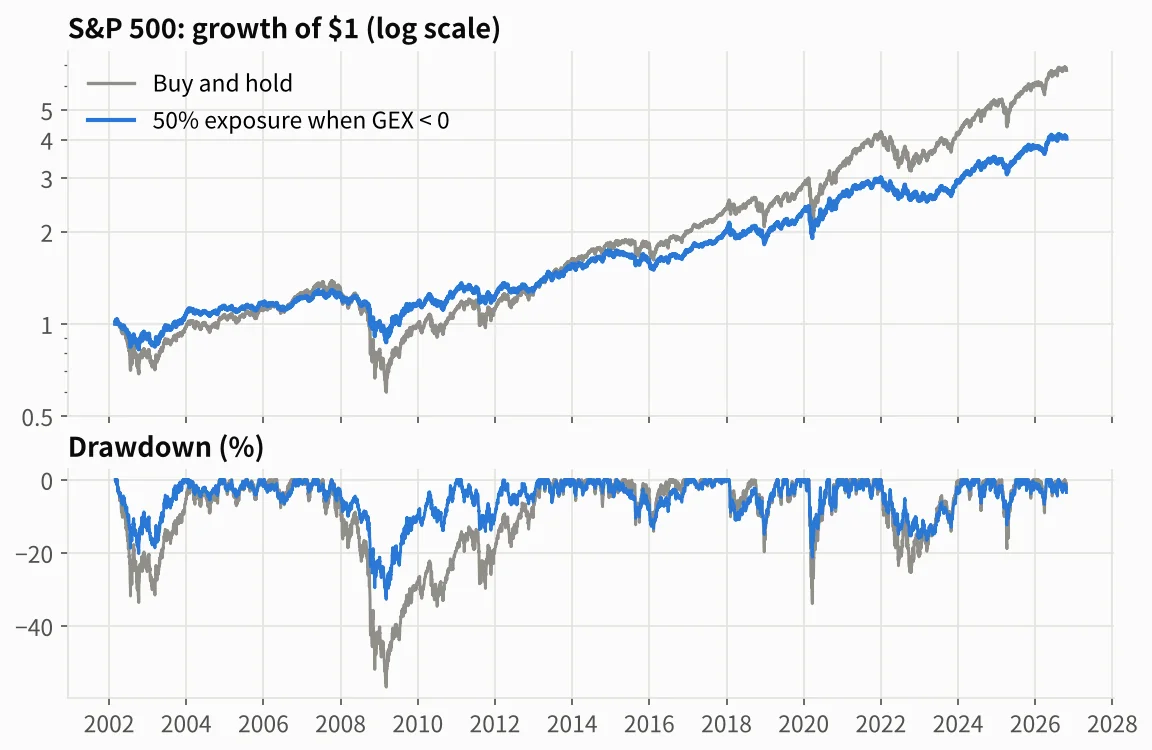
| 2002–2026 | Annual return | Volatility | Sharpe | Max drawdown | Worst day |
|---|---|---|---|---|---|
| Buy and hold | 8.2% | 19.0% | 0.51 | −56.8% | −12.0% |
| 50% when GEX < 0 | 5.9% | 12.2% | 0.53 | −32.8% | −6.0% |
| 50% when VIX ≥ 18 | 5.6% | 11.7% | 0.53 | −33.3% | −6.0% |
| Volatility target 12% (21-day realized) | 6.9% | 11.6% | 0.64 | −29.2% | −4.1% |
| Volatility target 12% + GEX | 4.9% | 8.5% | 0.61 | −16.3% | −4.1% |
The GEX rule cut the maximum drawdown from −57% to −33% and the worst day from −12% to −6%. Its return per unit of risk barely changed, though: a Sharpe ratio of 0.53 against 0.51. Short-gamma regimes contain the sharpest rebounds as well as the selloffs, so trimming exposure misses both. Adding GEX to a realized-volatility target cut the drawdown further, from −29% to −16%, without raising the Sharpe ratio. For stock exposure, GEX is a risk-reduction tool, not a return enhancer.
Key takeaways
- Volatility regime: next-day volatility after negative GEX was more than twice that after positive GEX. It held over 24 years, in every sub-period and in every VIX range, and it improved out-of-sample volatility forecasts beyond the VIX and realized volatility.
- Not direction: negative GEX comes with both the biggest selloffs and the biggest rebounds. Do not read it as a sell signal.
- Selling premium: selling volatility only when GEX is non-negative kept nearly all of the premium and cut the tail losses sharply. This is where GEX helps trading most directly.
- Stock exposure: about half the drawdown and half the worst day, with a similar Sharpe ratio. Use it to manage risk.
GEX is an estimate based on the assumption that dealers are long calls and short puts. These results describe historical data, do not guarantee future results and are not investment advice.
For how dealer gamma works in practice, read How to read gamma exposure (GEX). For the volatility side, the companion study How Late Is Realized Volatility? looks at how fast realized volatility catches up with implied volatility.