Home › Blog › Quant Research
Did 0DTE Options Make the S&P 500 More Volatile? Intraday Ranges, 2014–2026
Same-day (0DTE) options grew from 3% to more than 60% of SPX option volume. Many worry that this trading makes intraday swings larger. Measured against what the VIX implied for each day, intraday volatility has barely changed in ten years, and the 2022 launch of Tuesday and Thursday expirations, a natural experiment, gives the same answer.
The question
A 0DTE option disappears at that day's close. Its gamma is very large, so the hedging of these positions can add to intraday moves when dealers are short gamma, or absorb them when they are long. As this trading surged after 2022, the claim that 0DTE makes the market more fragile came up again and again. This study tests that claim as far as daily data allow.
Data and method
- 0DTE share: from the closing SPX option chain (standard contracts) each day, the volume in contracts expiring that day as a share of total volume.
- Intraday volatility: range volatility from the day's high and low (the Parkinson estimator), which captures intraday movement better than closing prices alone.
- Benchmark: the prior close's VIX converted to a daily figure (VIX ÷ √252). Because the overall level of fear changes from year to year, I compare intraday volatility with what the VIX implied for that day. If 0DTE made intraday moves larger, this ratio should rise.
- Period: January 2014 to October 21, 2026. 2012–13 is left out because of problems in the opening-price data.
1. The 0DTE share grew more than twentyfold
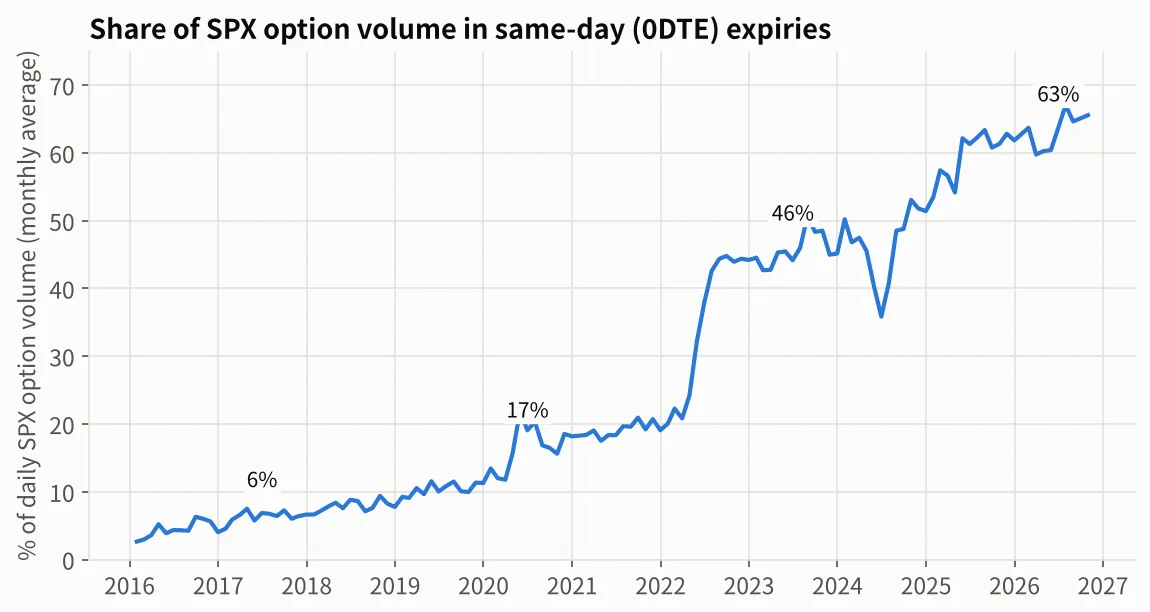
Before 2016 only a few weekdays, mainly Fridays, had a same-day expiry, and the share averaged around 3%. With Monday, Wednesday and Friday expirations in place it averaged 12% in 2017–2021, then 50% once every weekday had one from 2022, reaching 63% in 2026.
2. Intraday volatility relative to the VIX did not move
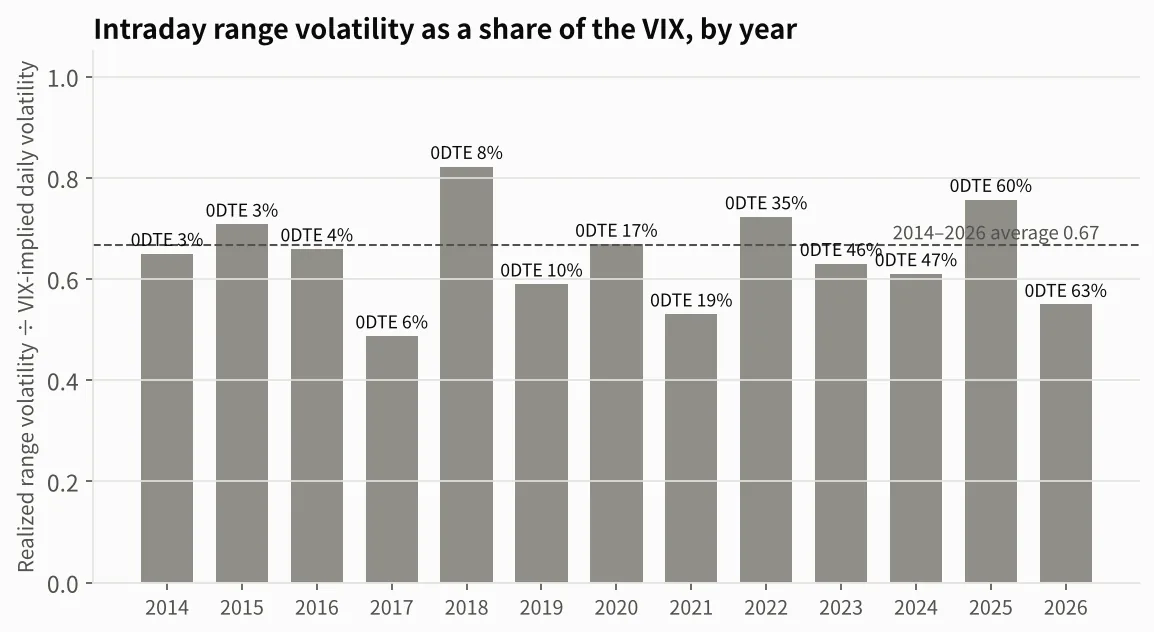
The ratio swung between 0.49 and 0.82 from year to year, but not with the 0DTE share. It averaged 0.68 in 2014–16 with almost no 0DTE, 0.65 in 2017–21 at a 12% share, and 0.68 in 2022–26 at 50%. The correlation between the yearly 0DTE share and the ratio is −0.03. The high years, such as 2018 (the February volatility spike) and 2025 (the April tariff shock), are explained by their events, not by 0DTE.
I also checked whether trend days became more common. The open-to-close move divided by the high-low range (1 means the day opened at its low and closed at its high, or the reverse) averaged 0.52 in 2014–16, 0.48 in 2017–21 and 0.50 in 2022–26. No increase.
3. A natural experiment: Tuesday and Thursday expirations
Year-by-year comparisons mix in each year's events. A cleaner test exists. Cboe added Tuesday SPX expirations in late April 2022 and Thursday expirations in mid-May. Before that, Tuesdays and Thursdays had almost no 0DTE trading while Mondays, Wednesdays and Fridays already did. If 0DTE raised intraday volatility, Tuesdays and Thursdays should have become more volatile than the other days after the launch.
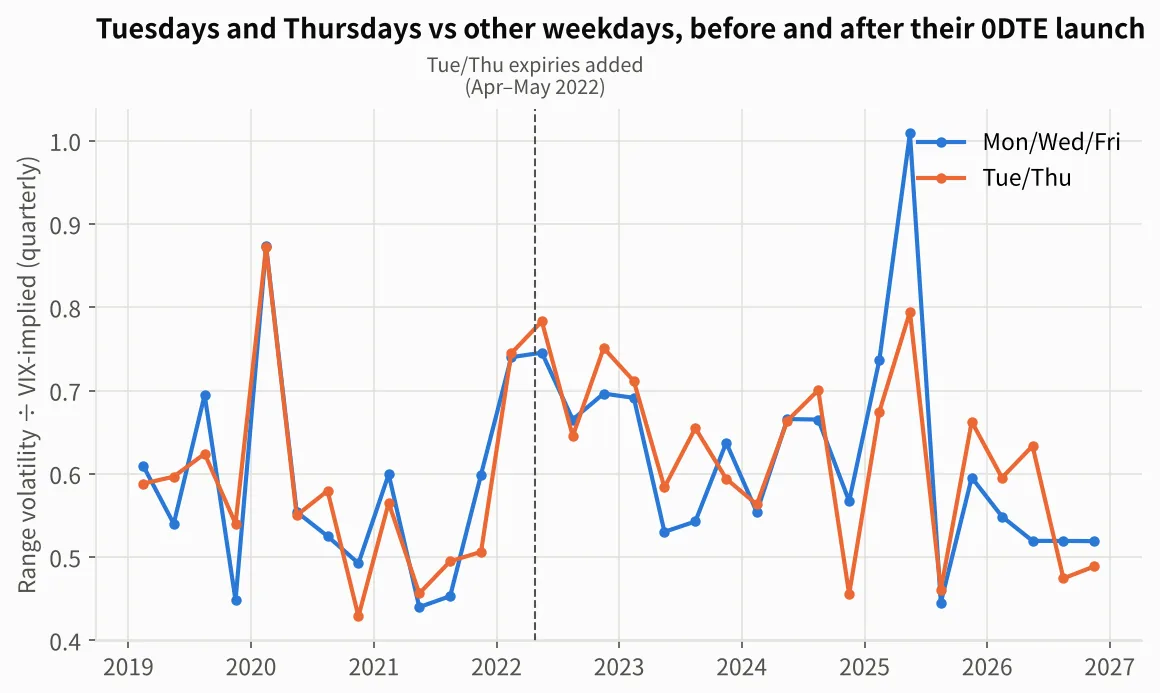
The two lines move together before and after. The 2022 bear market lifted the ratio on every weekday, and Tuesdays and Thursdays did not rise by more. Comparing January 2019–April 2022 with June 2022–October 2026, the relative change on Tuesdays and Thursdays is −1.2%, with a 95% confidence interval of −7.7% to +5.8%. Excluding the 2020 crash gives −2.5%, also not significant. Days with a range more than 1.5 times the VIX-implied move did not become more frequent on Tuesdays and Thursdays either.
4. Day by day, a weak link
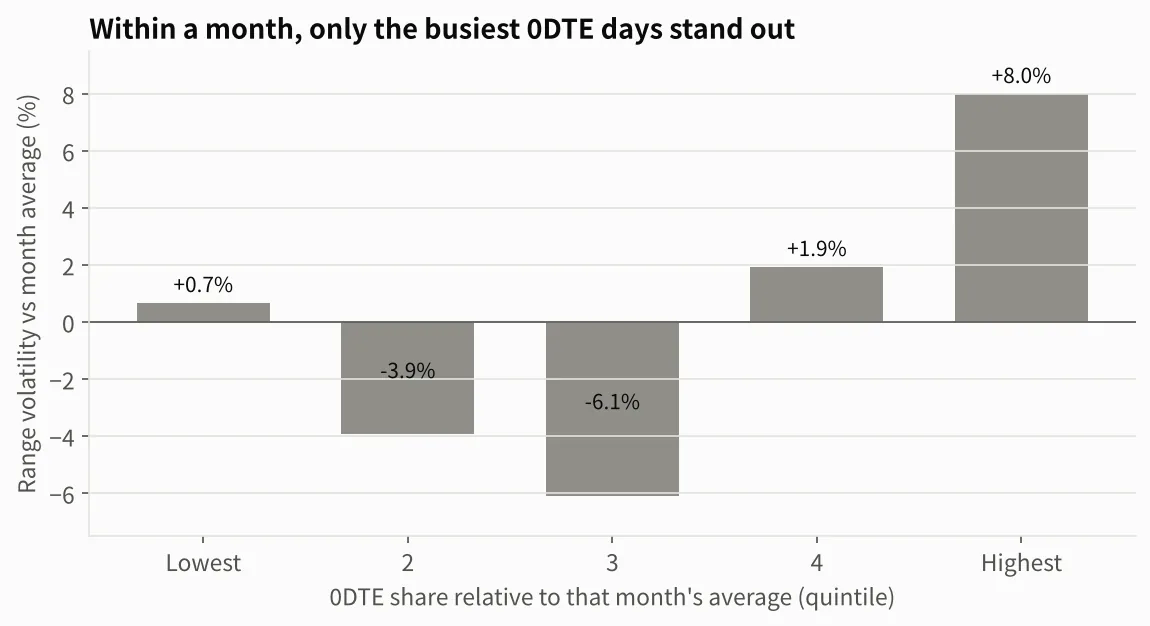
From June 2022, when every day had a 0DTE expiry, the fifth of days with the highest 0DTE share within each month had intraday volatility 8% above the month's average. In a regression, a 10-point higher share went with about 4% higher volatility (t-statistic about 2.0). The direction is unclear: on volatile days more traders reach for same-day options, so volatility may drive 0DTE volume rather than the reverse. The size is also small, about what a half-point move in the VIX does.
5. A side note: VIX1D is priced above realized
Since VIX1D (implied volatility for the next day) launched in May 2022, intraday range volatility has averaged 0.73 of VIX1D and close-to-close volatility 0.93. On average, one-day options were priced above the moves that followed: buyers of 0DTE protection still pay a premium, and sellers still collect it.
Key takeaways
- The big picture: as the 0DTE share rose from 3% to 63%, intraday volatility relative to the VIX and the share of trend days did not rise.
- The natural experiment: after Tuesdays and Thursdays gained 0DTE expiries, their volatility moved exactly like the other weekdays.
- Day to day: days with unusually heavy 0DTE trading had slightly wider ranges, but cause and effect cannot be separated.
- Limits: daily highs and lows cannot see short windows such as the last half hour of trading. Any 0DTE effect may live in those windows rather than in the day as a whole.
Data: SPX daily open, high, low and close and the VIX from Cboe; volume from closing SPX option chains. Results describe historical data and are not investment advice.
For how dealer gamma works, read How to read gamma exposure (GEX). The companion study Negative Gamma, Bigger Moves looks at what the sign of dealer gamma says about next-day volatility.