Home › Blog › Daily Market Review
Daily Market Review · US close
SPX rally halves dealers' short gamma, but event-week vol stays priced
SPX rose 0.7% to 7,677 and net GEX shrank from −$42.6B to −$22.6B. VIX1D collapsed to 10.5 while Wednesday–Friday expiries still price 14.5–16.3% ATM vol. Here are the levels for Tuesday.
- Anthropic's public IPO filing revived the AI trade: SPX +0.7% to 7,677, NDX +1.1%, with chips and Tesla leading. Breadth was roughly even.
- Dealer gamma shrank from −$42.6B to −$22.6B. SPX closed 26 points under its 7,703 flip, and almost all of the remaining short gamma at spot expires by Friday.
- VIX fell 1.06 to 18.39 and VIX1D dropped to 10.5, the November VIX future is back below December (contango restored), and the Oct 28–30 SPX expiries still price 14.5–16.3% ATM vol vs 11.8% for Tuesday.
Scoreboard
| Close | Chg | Prev | |
|---|---|---|---|
| SPX | 7,677 | +0.70% | 7,624 |
| NDX | 29,273 | +1.09% | 28,958 |
| VIX | 18.39 | −1.06 | 19.45 |
| VIX1D | 10.49 | −6.32 | 16.81 |
| VVIX | 101.4 | −8.3 | 109.7 |
| VX Nov / Dec | 19.16 / 19.20 | +0.19% M1→M2 | −0.60% |
| VIX / VIX3M | 0.922 | −0.028 | 0.950 |
| 30D ATM IV / skew | 14.3% / 11.9 | −0.5 / −0.9 | 14.8% / 12.8 |
| Window | Net GEX | Chg | Prev | Flip | Call wall | Put wall | |
|---|---|---|---|---|---|---|---|
| SPX | All | −$22.6B | +$20.0B | −$42.6B | 7,703 | 8,000 | 7,000 |
| SPX | Weekly | −$24.5B | +$7.2B | −$31.7B | 7,719 | 7,700 | 7,650 |
| SPX | Monthly | −$41.0B | +$13.2B | −$54.2B | 7,732 | 8,000 | 7,650 |
| NDX | All | −$0.42B | +$0.89B | −$1.31B | 29,384 | 29,675 | 28,000 |
| NDX | Weekly | +$0.07B | +$0.56B | −$0.49B | 29,215 | 29,400 | 29,000 |
| NDX | Monthly | +$0.39B | +$0.81B | −$0.42B | 29,121 | 29,675 | 27,500 |
Dealer gamma by expiry window. All = every listed expiry; Weekly = contracts expiring within 7 calendar days; Monthly = within 30 days. Net GEX in $ per 1% move.
1. The tape: the AI trade gets a new catalyst
Anthropic made its IPO filing public, planning a Nasdaq listing under the ticker ANT, and the prospectus showed more than $16 billion of first-half revenue. That was enough to pull AI hardware back up after last week's selloff. The S&P 500 rose 0.7% to 7,677, the Nasdaq Composite gained 0.8%, the Nasdaq-100 1.1%, the Dow 0.3% and the Russell 2000 0.4%. Underneath, breadth was close to even, with advancers and decliners roughly matched.
Leaders were mostly AI and hardware names. Nvidia gained 2.4% and optical-networking stocks rallied, with Lumentum up about 10% after a new analyst initiation. Tesla rose about 6% on a Barclays upgrade. Microsoft added 1.5% after announcing voluntary buyouts for about 60,000 employees, while Alphabet slipped about 1%. Range Resources jumped on an all-stock takeover by EQT valued above $50 billion. Fair Isaac was a notable decliner, and Brazilian stocks such as XP and Nu fell hard after the country's presidential runoff.
Cross-asset was quiet. WTI eased to about $101 and Brent traded near $110–112 after a Saudi official's visit to Tehran. The 10-year Treasury yield held near 4.99%, while the 2-year rose about 3 basis points. Fed funds futures put the odds of a hike at Wednesday's FOMC decision near 10%.
Why it matters for vol: a calm up day crushed one-day implied vol but left the event dates untouched. The market is selling vol it doesn't need (Tuesday) and still paying for the days it does (FOMC, megacap earnings, GDP and PCE).
2. Dealer gamma: half as short, still below the line
Net GEX across all expiries rose to −$22.6B per 1% move, from −$42.6B on Friday. The flip barely moved (7,703 vs 7,705). SPX closed at 7,677, so the gap narrowed from 81 points to 26 points (0.3%). Dealers are still short gamma, but the drag is much smaller.
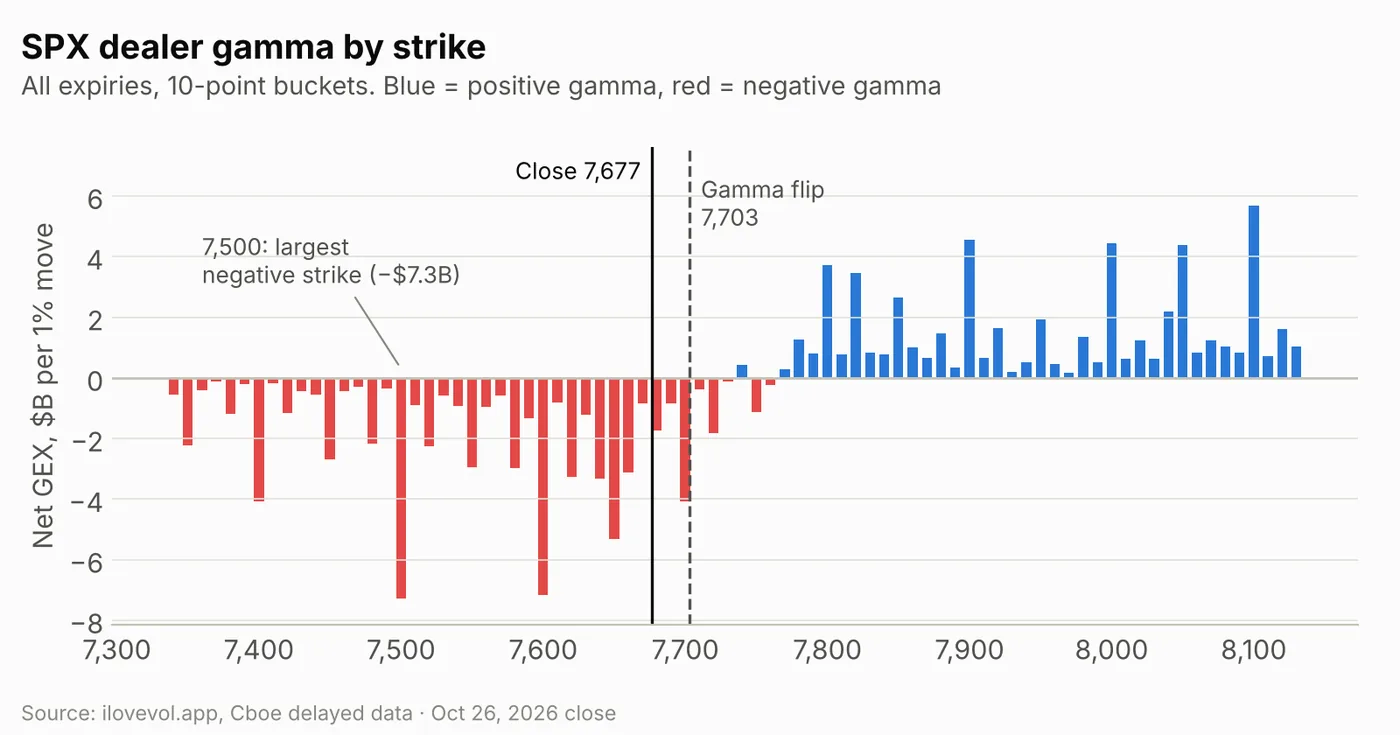
The strike map hasn't changed shape. The biggest negative buckets are still 7,500 (−$7.3B) and 7,600 (−$7.2B), followed by 7,650 (−$5.3B) and 7,700 (−$4.1B). The first positive bucket above spot is 7,740, and the largest call strikes sit at 8,100, 7,900, 8,000 and 8,050.
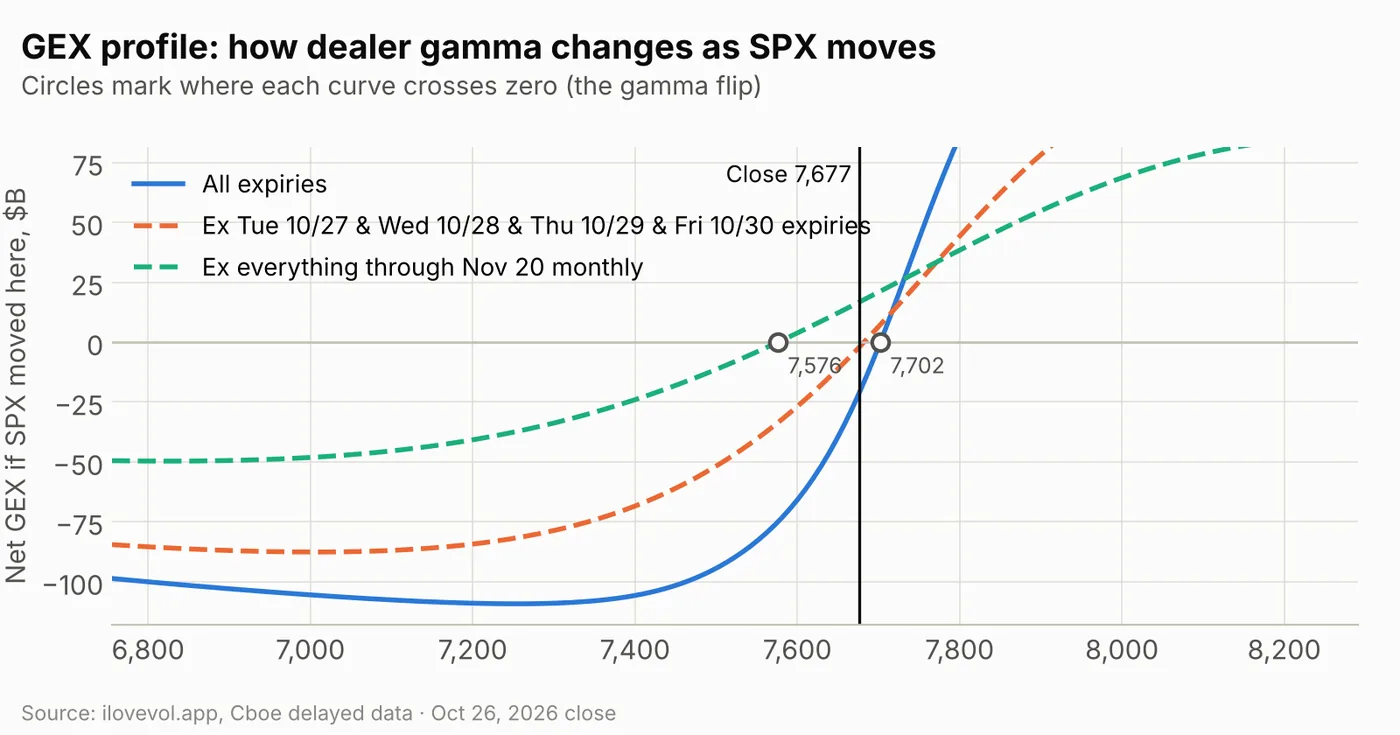
The profile puts all-expiry gamma at today's price near −$21B. Two points:
The short gamma at spot is this week's. Remove the four expiries from Tuesday to Friday and gamma at spot goes to roughly −$2B, close to neutral, with a flip near 7,682. Once Friday's expiry rolls off, the hedging drag at current levels largely disappears unless new positions replace it.
Beyond the November monthly, dealers are long. Strip out everything through Nov 20 and gamma at spot is about +$17B, with a flip near 7,576. Below spot, though, the all-expiry curve still falls steeply, to about −$109B near 7,250. A break of 7,600 would still meet little dealer support.
Weekly vs monthly: where the short gamma lives
Splitting gamma by expiry window (net GEX, flip and walls for each window are in the dealer-gamma table under the scoreboard) shows that the next seven days carry more than all of the net short gamma, and that each window's levels sit in a tight band around spot. Weekly = contracts expiring within 7 calendar days; Monthly = within 30 days.
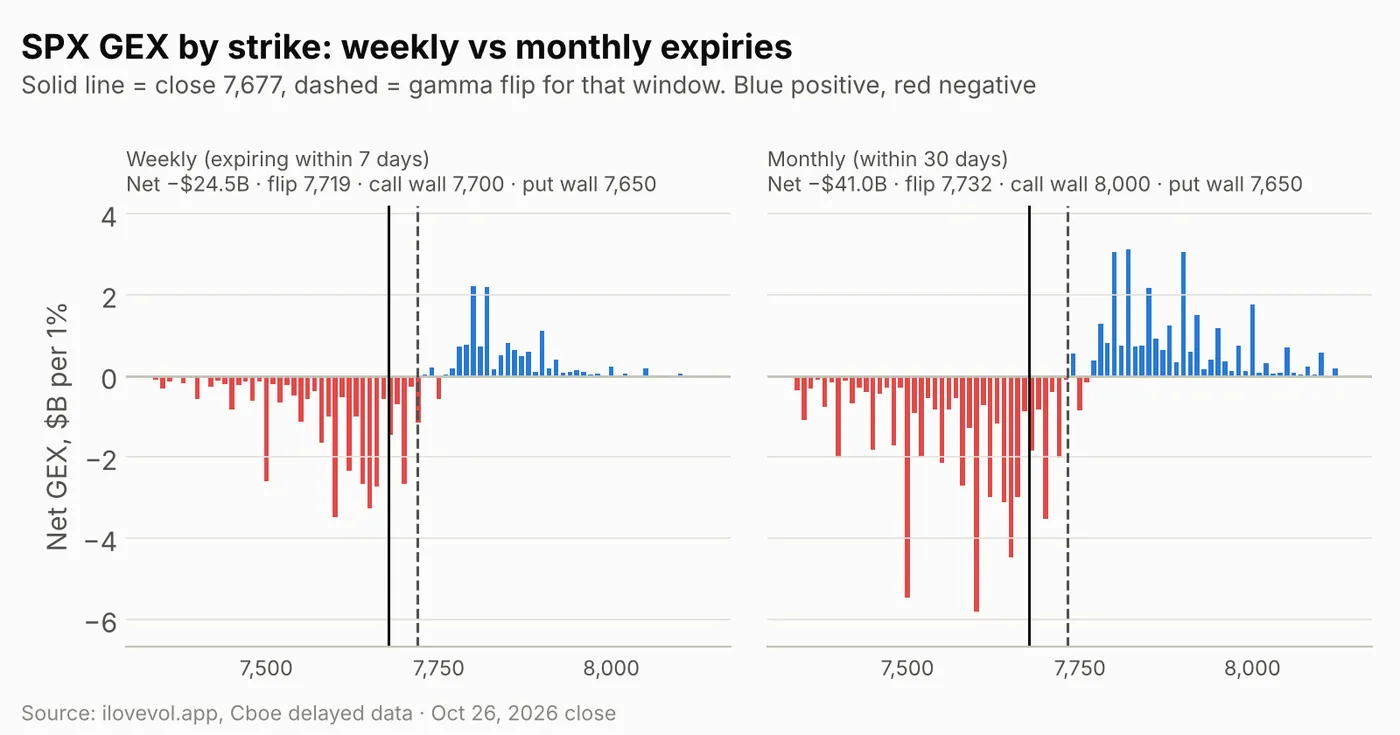
SPX weekly: the next 7 days carry −$24.5B, more than the all-expiry total, so everything beyond a week is slightly net long. The window spans the FOMC, GDP/PCE and the Oct 30 expiry. Its flip is 7,719, its call wall is 7,700, just 23 points above the close, and its put wall is 7,650. That is a 50-point band around spot.
SPX monthly: the 30-day window is −$41.0B (flip 7,732), less negative than Friday's −$54.2B. Its put wall moved up to 7,650 from 7,500, and its call wall is 8,000. Expiries beyond 30 days are net long about $18B, which offsets almost half of the near-term short gamma.
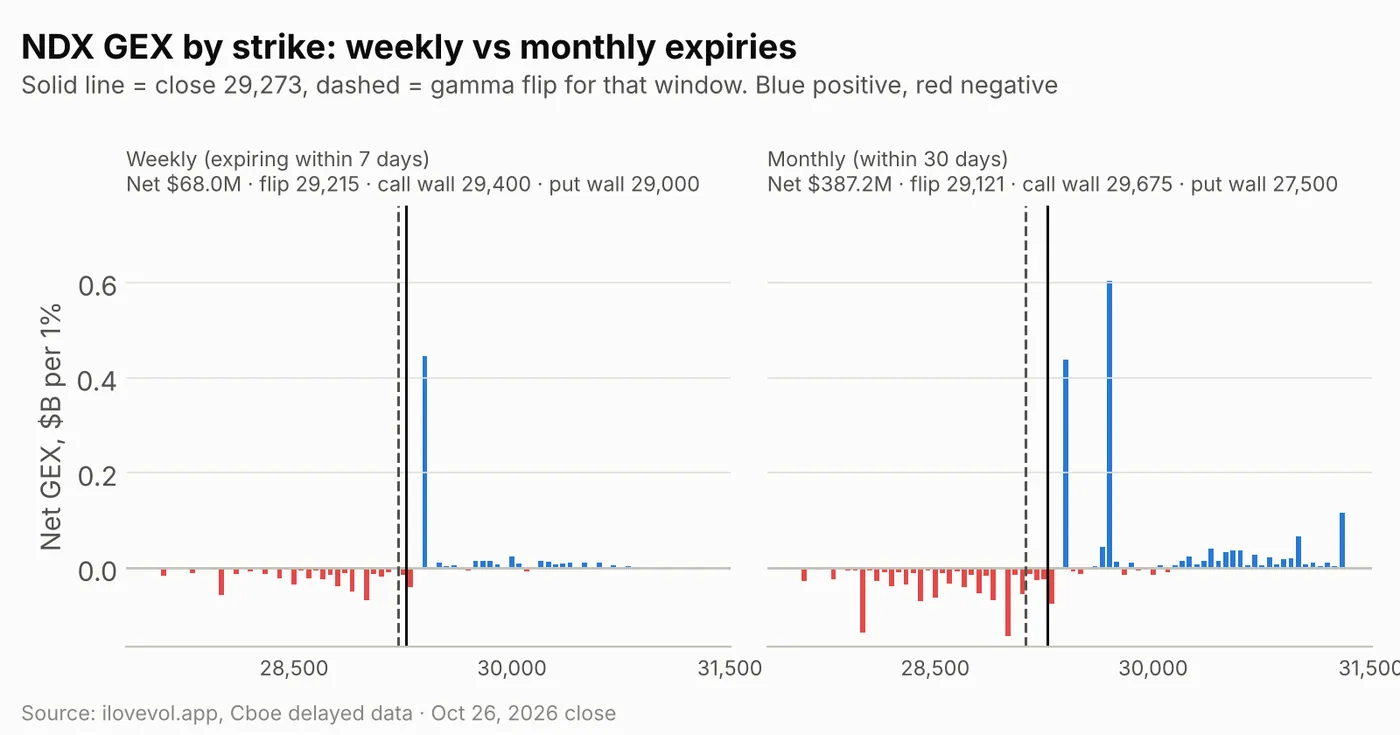
NDX rose 1.1% and its short gamma nearly disappeared, from −$1.31B to −$0.42B. The index is 0.4% under its 29,384 all-expiry flip, but it is already above the weekly flip (29,215) and the monthly flip (29,121). Both near-term windows are now slightly positive (+$0.07B and +$0.39B). The remaining short gamma sits beyond 30 days, about −$0.8B. The weekly window has a 29,400 call wall and a 29,000 put wall. The monthly window has a 29,675 call wall, with the largest call strikes at 29,700 and 29,400.
RUT gained 0.4% but remains short gamma (−$1.22B), 49 points under its 2,835 flip, with a 2,850 call wall and a 2,700 put wall.
3. The VIX complex: the front end deflates, the kink is gone
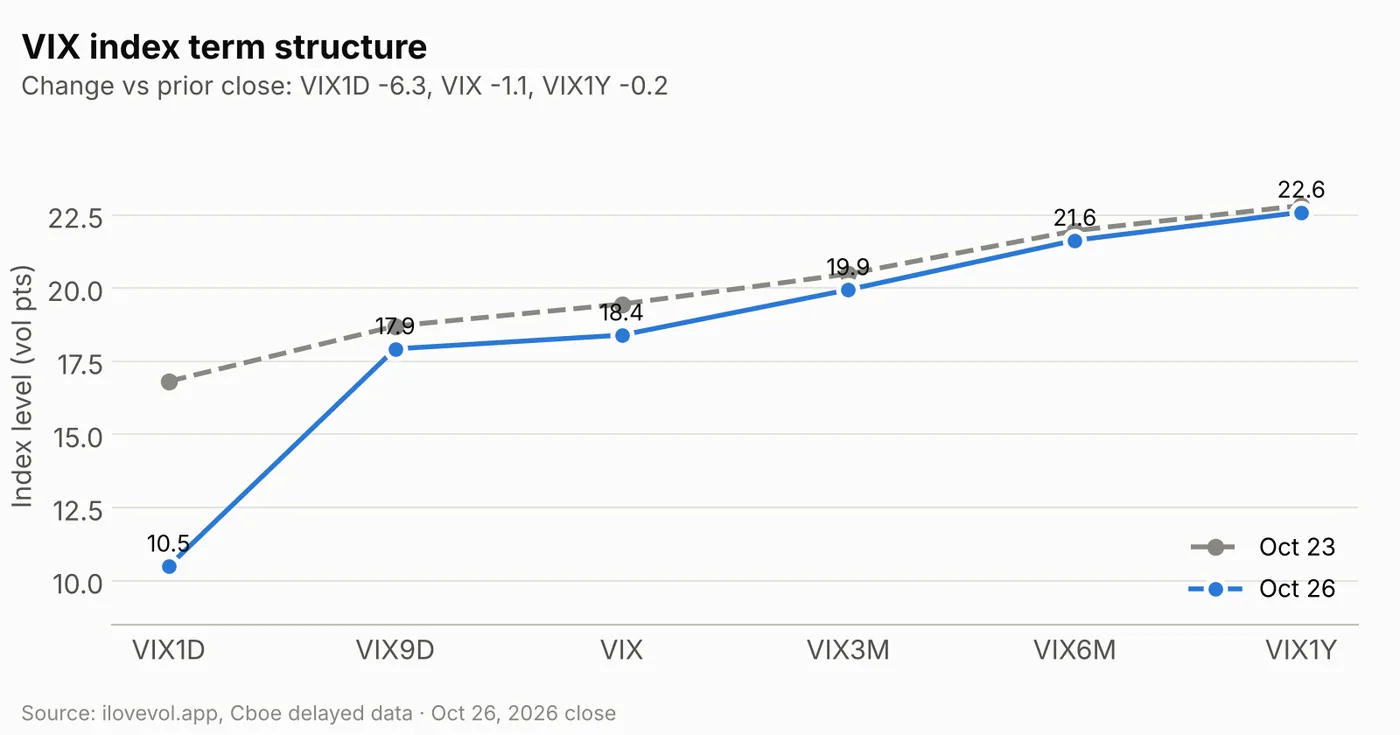
Almost all of the move was at the very front. VIX1D fell 6.3 points to 10.5, while VIX9D slipped only 0.8 to 17.9 and VIX lost 1.06 to 18.39. VIX1Y moved just 0.2. The 1-day to 9-day gap is now more than 7 points, which is what an event-heavy week looks like: tomorrow is quiet, the next nine days are not.
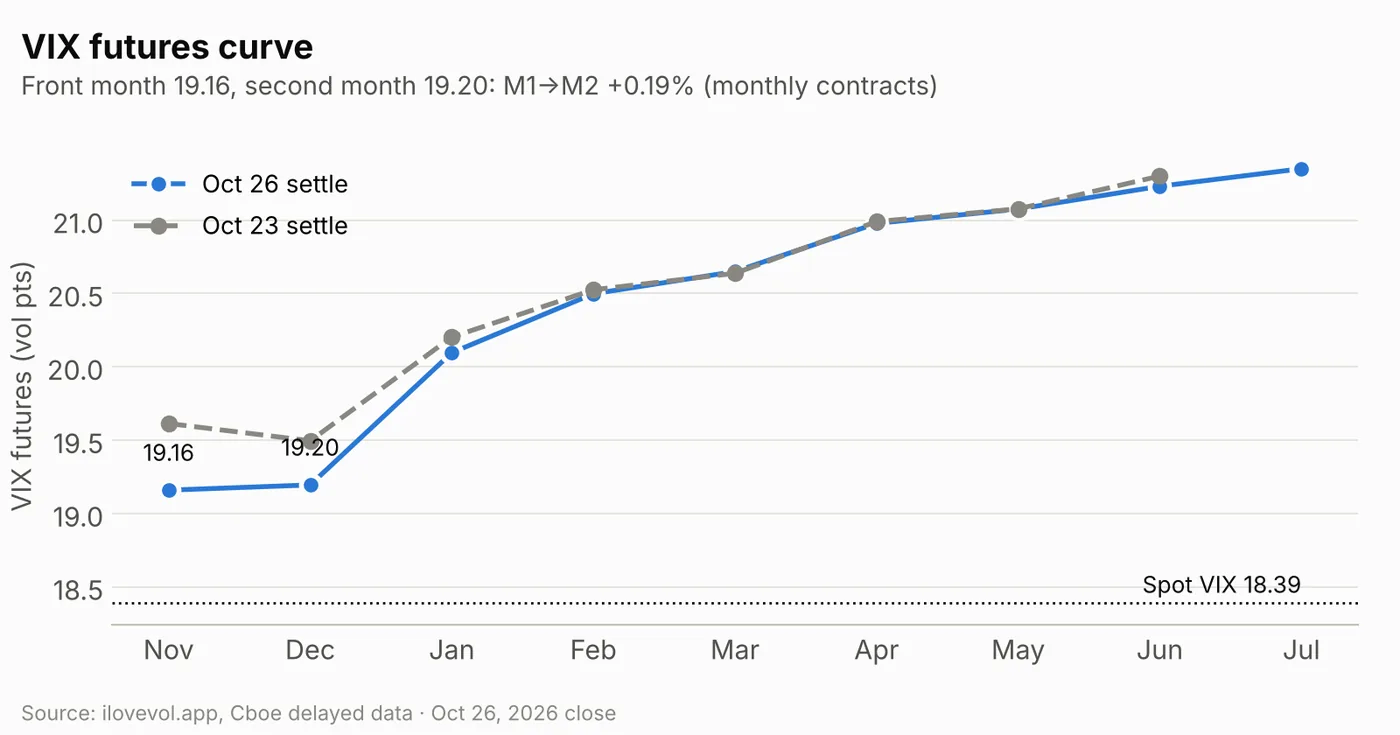
November futures settled at 19.16, down 0.45, and December at 19.20, down 0.30. With November falling more, the front kink closed: M1→M2 is back to +0.19% from −0.60%. November is about 4.2% above spot, up from 0.8% on Friday, a more normal carry. January and later months barely moved. VVIX fell 8.3 points to 101.4, so demand for VIX upside cooled.
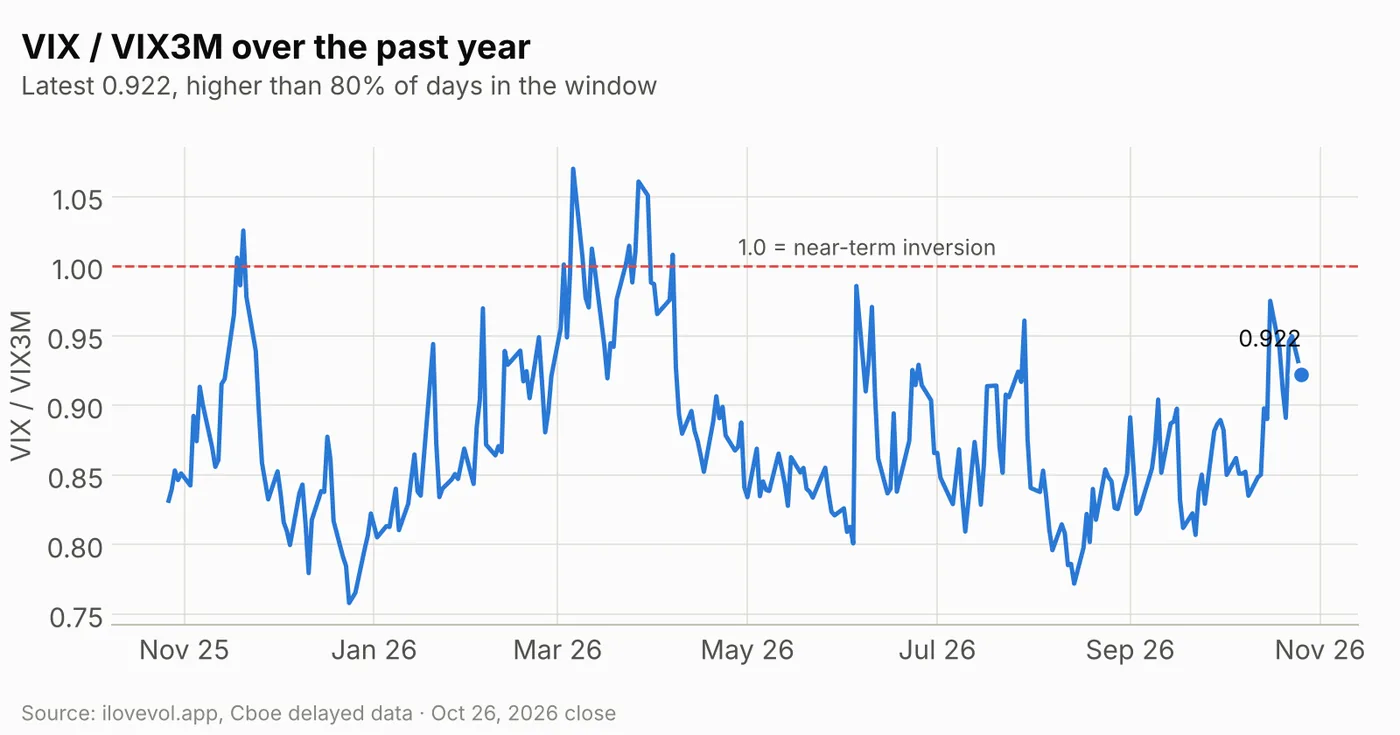
VIX/VIX3M fell to 0.922 from 0.950. It is still higher than 80% of the past year's sessions, so the near end remains elevated relative to three months, just less so than last week.
4. Implied vs realized: the cushion narrows a bit
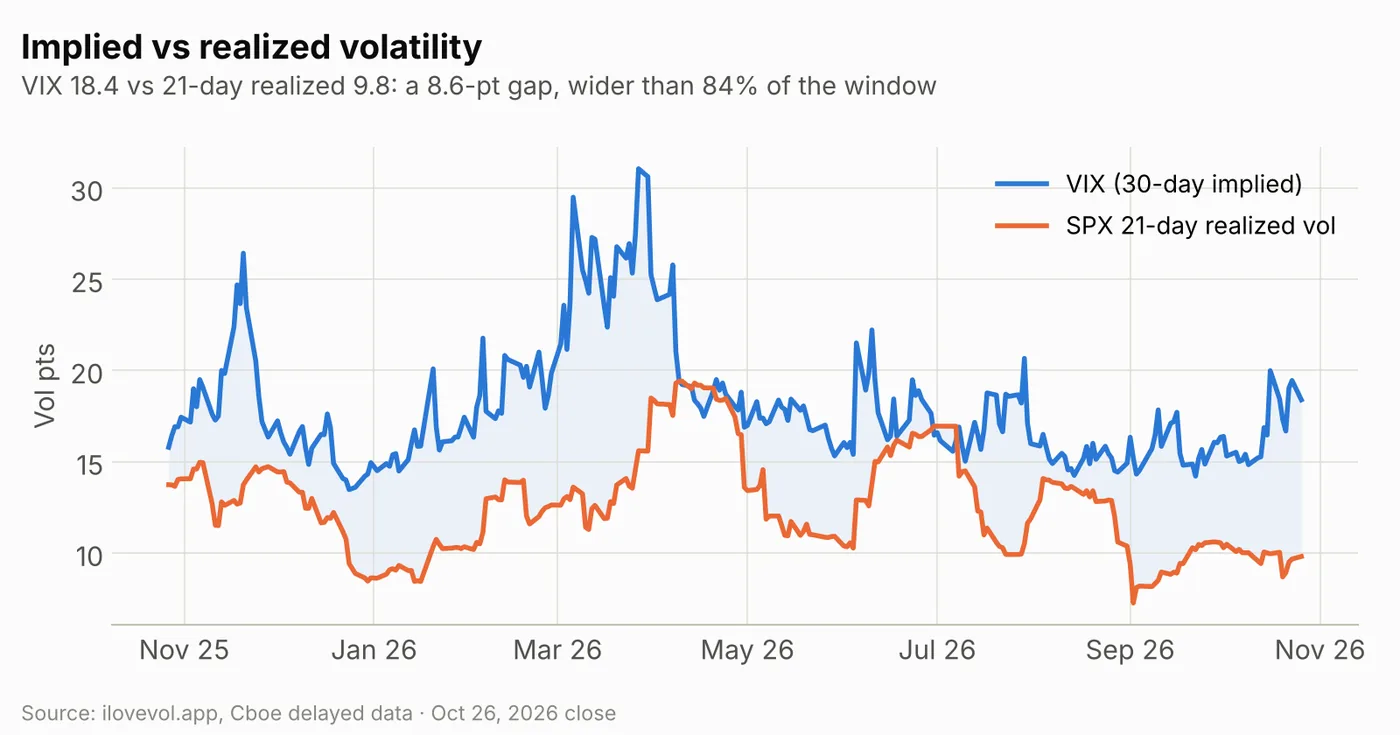
SPX 21-day realized vol is 9.8. With VIX at 18.4, the gap is 8.6 points, down from about 9.8 on Friday but still wider than 84% of the past year. Options continue to price nearly twice the vol SPX has delivered. This week's calendar is the test of whether that premium was worth paying.
5. The SPX surface: skew eases, event pricing holds
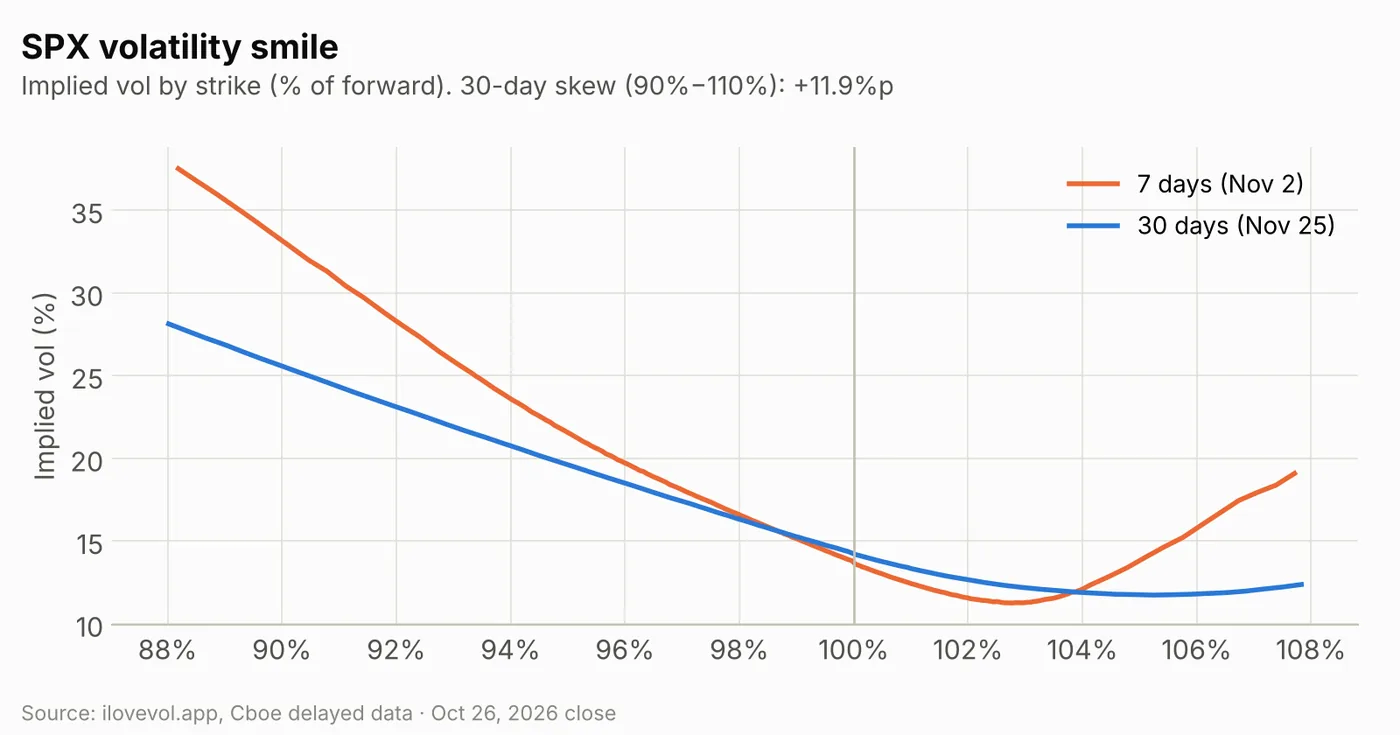
Thirty-day ATM IV eased to 14.3% from 14.8%, and 30-day skew (90% vs 110%) flattened to 11.9 points from 12.8. The 90D−30D term slope is +0.3 points. The 7-day smile (Nov 2) is still steep, with 88% puts near 37% vol, and its call wing curls up from about 104%. The 30-day curve (Nov 25) tops out near 28% at 88%.
The expiry table is where the event pricing shows. ATM IV is 11.8% for Tuesday, then 14.5% for Wednesday (FOMC day), 16.0% for Thursday (GDP and PCE, after Microsoft and Alphabet report) and 16.3% for Friday Oct 30 (after Amazon). It drops back to 13.7% for Nov 2 and 13.9% for Nov 3, then rises to 14.7% for Nov 4, the first expiry after the midterm vote.
6. Cross-asset Vol Sentiment: the stress is in rates and credit
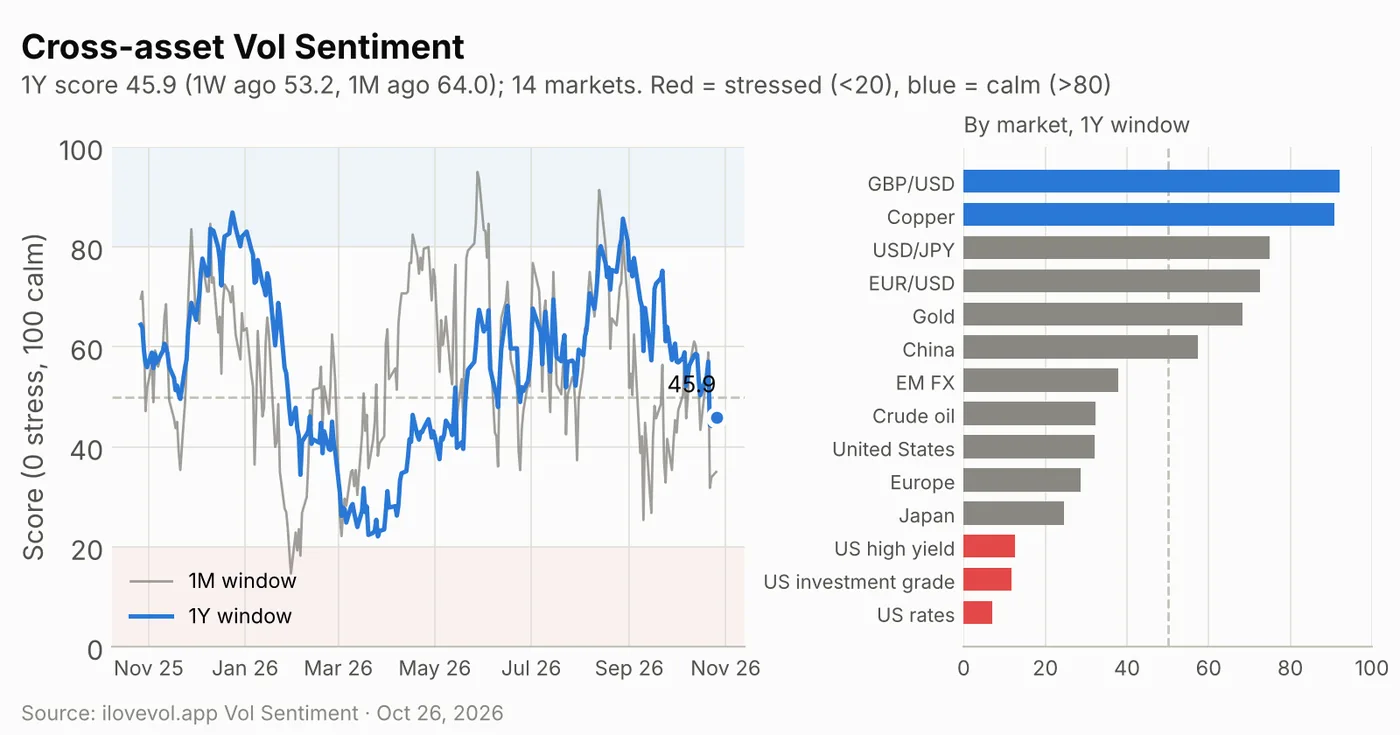
The cross-asset Vol Sentiment score places volatility in 14 equity, currency, rates, credit and commodity markets within its own one-year range (0 = stress, 100 = calm). On the one-year window it is 45.9, on the stressed side of 50, down from 53.2 a week ago and 64.0 a month ago, and lower than 71% of the past year's sessions. Shorter windows react first: the one-month score is 35.0 and the three-month score 28.1.
The stress is concentrated in fixed income: US rates (7.1), investment grade (11.7) and high yield (12.5) all sit near the top of their one-year vol ranges. US equities score 32.1, close to Europe (28.8) and Japan (24.6). At the calm end, GBP/USD (92.1) and copper (90.8) are near the bottom of their ranges, and EUR/USD and USD/JPY are above 70. Monday's rally eased equity index vol, but the broader backdrop still leans stressed, led by rates and credit going into the FOMC.
Calendar: the week ahead
Economic data & Fed
| Date | Time (ET) | Event | Note |
|---|---|---|---|
| Tue Oct 27 | 8:30 | Durable goods orders (Sep) | |
| Tue Oct 27 | 10:00 | Consumer confidence (Oct) | |
| Wed Oct 28 | 14:00 | FOMC decision, press conference after | Hold expected; Oct 28 expiry 14.5% ATM vs 11.8% Tue |
| Thu Oct 29 | 8:30 | Q3 GDP (advance), Sep PCE inflation, jobless claims | Oct 29 expiry 16.0% ATM |
| Thu Oct 29 | – | ECB decision | |
| Fri Oct 30 | 8:30 | Employment cost index (Q3) | |
| Fri Oct 30 | 9:45 | Chicago PMI (Oct) | |
| Mon Nov 2 | 10:00 (expected) | ISM manufacturing (Oct) |
Earnings
| Date | Timing | Companies | Note |
|---|---|---|---|
| Tue Oct 27 | Before open | Boeing, UPS, Coca-Cola, PayPal | |
| Tue Oct 27 | After close | Visa, NXP, Seagate | |
| Wed Oct 28 | After close | Microsoft, Alphabet, ServiceNow, KLA | Reaction in the Oct 29 expiry |
| Thu Oct 29 | Before open | Eli Lilly, Caterpillar, Mastercard, Merck | |
| Thu Oct 29 | After close | Amazon, Intel, Coinbase, Reddit | Reaction in the Oct 30 expiry (16.3% ATM) |
| Fri Oct 30 | Before open | Exxon Mobil, Chevron, AbbVie |
Volatility dates (expirations, events)
| Date | Event | Note |
|---|---|---|
| Fri Oct 30 | Month-end SPX expiry | Highest ATM IV on the curve (16.3%) |
| Tue Nov 3 | US midterm elections | Nov 4 expiry (first after the vote) 14.7% ATM vs 13.9% Nov 3 |
| Wed Nov 18 | VIX November futures and options expiration | |
| Fri Nov 20 | SPX November monthly expiration | Dealer short gamma is concentrated through this date |
What I'm watching on Tuesday
- 7,700–7,732. The weekly call wall (7,700), the all-expiry flip (7,703), the weekly flip (7,719) and the monthly flip (7,732). A close above this band would put dealers back in positive gamma.
- 7,650, then 7,600 and 7,500. The weekly and monthly put wall, then the two largest negative strikes. Below 7,600 the profile shows little dealer support.
- Friday's roll-off. Nearly all of the short gamma at spot expires between Tuesday and Friday. If SPX holds this range through the events, the hedging drag fades quickly.
- The Oct 28–30 premium and VVIX. ATM IV of 14.5–16.3% for Wednesday–Friday vs 11.8% for Tuesday. Watch whether it bleeds into the events or gets realized.
- Rates and credit vol. US rates, investment grade and high yield are the most stressed markets in Vol Sentiment (scores 7–13). Equity index vol eased on Monday while they did not; watch whether they lift after the FOMC.
Sources
- Yahoo Finance: Dow, S&P 500, Nasdaq gain as Anthropic IPO buzz reignites AI trade ahead of busy tech earnings week
- TheStreet: Stock Market Today (Oct. 26, 2026)
- Charles Schwab: Stocks Up, Oil Down Ahead of Earnings Blitz, Fed
- eOption: Weekly Event Calendar, Oct 26–30, 2026
- Investing.com: Earnings week preview, Microsoft, Amazon, Intel and more report Oct 26–29
- Gotrade: Week Ahead, Fed Decision, US GDP and Big Tech Earnings
Volatility data: ilovevol.app, from Cboe delayed quotes. GEX assumes dealers are long calls and short puts. VIX futures use settlement prices. Vol Sentiment: ilovevol.app cross-asset score (0 = stress, 100 = calm), one-year window unless noted.
This review is for informational and educational purposes only and is not investment advice. See the disclaimer.