Home › Blog › Daily Market Review
Daily Market Review · US close
Hot CPI and a 10-year near 5%: SPX dips 0.4% as dealer short gamma deepens to −$51B
October CPI beat forecasts and December hike odds rose. SPX fell 0.38% to 7,521 and net GEX widened from −$37.7B to −$51.1B. CPI's priced 90-point move turned into 29 points; VIX1D fell to 13.95, while 21-day realized vol (21.2) stays above VIX (19.46).
- October CPI rose 0.4% m/m (0.3% expected), core 0.3% (0.2% expected). The 10-year yield rose to about 5% and traders leaned further toward a December hike. SPX −0.38% to 7,521, NDX −0.60%; Nvidia fell 5.5% and about 61% of issues declined.
- Net GEX widened to −$51.1B from −$37.7B, and SPX closed 89 points under its 7,610 flip. The weekly call wall dropped to 7,550 from 7,650; the weekly put wall (7,510) and the largest negative strike, 7,500 (−$7.9B), sit just below the close.
- The CPI expiry priced about 90 points; SPX moved 29. VIX1D fell 3.36 to 13.95 and VIX 0.46 to 19.46, but 21-day realized vol is 21.2, still above VIX. Next event premiums: PPI Friday (Nov 13 expiry 16.8% ATM) and Nvidia Nov 17 (Nov 18 expiry 15.5%).
Scoreboard
| Close | Chg | Prev | |
|---|---|---|---|
| SPX | 7,521 | −0.38% | 7,550 |
| NDX | 27,741 | −0.60% | 27,908 |
| VIX | 19.46 | −0.46 | 19.92 |
| VIX1D | 13.95 | −3.36 | 17.31 |
| VVIX | 96.6 | −1.8 | 98.4 |
| VX Nov / Dec | 19.91 / 19.51 | −1.98% M1→M2 | −2.57% |
| VIX / VIX3M | 0.943 | −0.013 | 0.955 |
| 30D ATM IV / skew | 15.2% / 11.9 | −0.1 / 0.0 | 15.3% / 11.9 |
| Window | Net GEX | Chg | Prev | Flip | Call wall | Put wall | |
|---|---|---|---|---|---|---|---|
| SPX | All | −$51.1B | −$13.4B | −$37.7B | 7,610 | 8,000 | 7,000 |
| SPX | Weekly | −$12.0B | −$1.8B | −$10.2B | 7,590 | 7,550 | 7,510 |
| SPX | Monthly | −$45.8B | −$7.5B | −$38.3B | 7,632 | 7,700 | 7,500 |
| NDX | All | −$1.33B | −$0.24B | −$1.09B | 28,154 | 29,000 | 27,000 |
| NDX | Weekly | −$0.08B | +$0.07B | −$0.15B | 27,774 | 28,000 | 27,700 |
| NDX | Monthly | −$0.74B | −$0.14B | −$0.60B | 28,039 | 29,675 | 27,000 |
Dealer gamma by expiry window. All = every listed expiry; Weekly = contracts expiring within 7 calendar days; Monthly = within 30 days. Net GEX in $ per 1% move.
1. The tape: a hotter CPI, higher yields and a softer Nasdaq
The S&P 500 slipped 29 points (0.38%) to 7,521 after Monday's 2.35% rally. The Dow fell 0.30% to 52,232, the Nasdaq Composite 0.74% to 25,066 and the Nasdaq-100 0.60% to 27,741. The Russell 2000 lost 0.68% to 2,821. Breadth was negative, with about 61% of issues lower, but the equal-weight S&P 500 was down only about 0.2% at midday, so large tech did most of the damage.
October CPI rose 0.4% on the month against 0.3% expected, and core prices rose 0.3% against 0.2%. There was no year-over-year figure, because October 2025 data were never collected during the government shutdown. Governor Waller said before the release that he would back a 25 bp hike in December and that 50 bp should be considered if core rose 0.3% or more; Dallas Fed President Logan said two more hikes would be needed. Futures pricing leaned further toward a December hike, with more than 80% odds of 25 bp cited. The 10-year Treasury yield rose to about 5% (reports range from 4.98% to 5.00%).
Nvidia fell 5.5% to $168.89 as the board probe and a lawsuit tied to its CEO weighed, briefly taking its market value under $4 trillion. Microsoft dropped about 3% at midday after Anthropic announced workplace tools for Claude. Hims & Hers fell 16.5% after cutting its EBITDA forecast. Gold lost about 2% to just above $4,000, oil slipped about 1% to its lowest since late August, and bitcoin dipped under $74,000. CoreWeave reported after the close.
Why it matters for vol: Monday's surface priced about 90 points for the CPI session; SPX closed 29 points lower. The event premium was overpriced, and VIX1D fell to 13.95. But the backdrop got tighter, not calmer: dealers ended shorter gamma, the 10-year is near 5%, and realized vol (21.2) is still above VIX.
2. Dealer gamma: shorter again, 89 points under the flip
Net GEX across all expiries widened to −$51.1B per 1% move from −$37.7B. The flip slipped to 7,610 from 7,624, and SPX closed 89 points (1.2%) under it, compared with 74 on Monday. A modest down day was enough to push dealers deeper into short gamma, because the close sits right on top of the heaviest negative strikes.
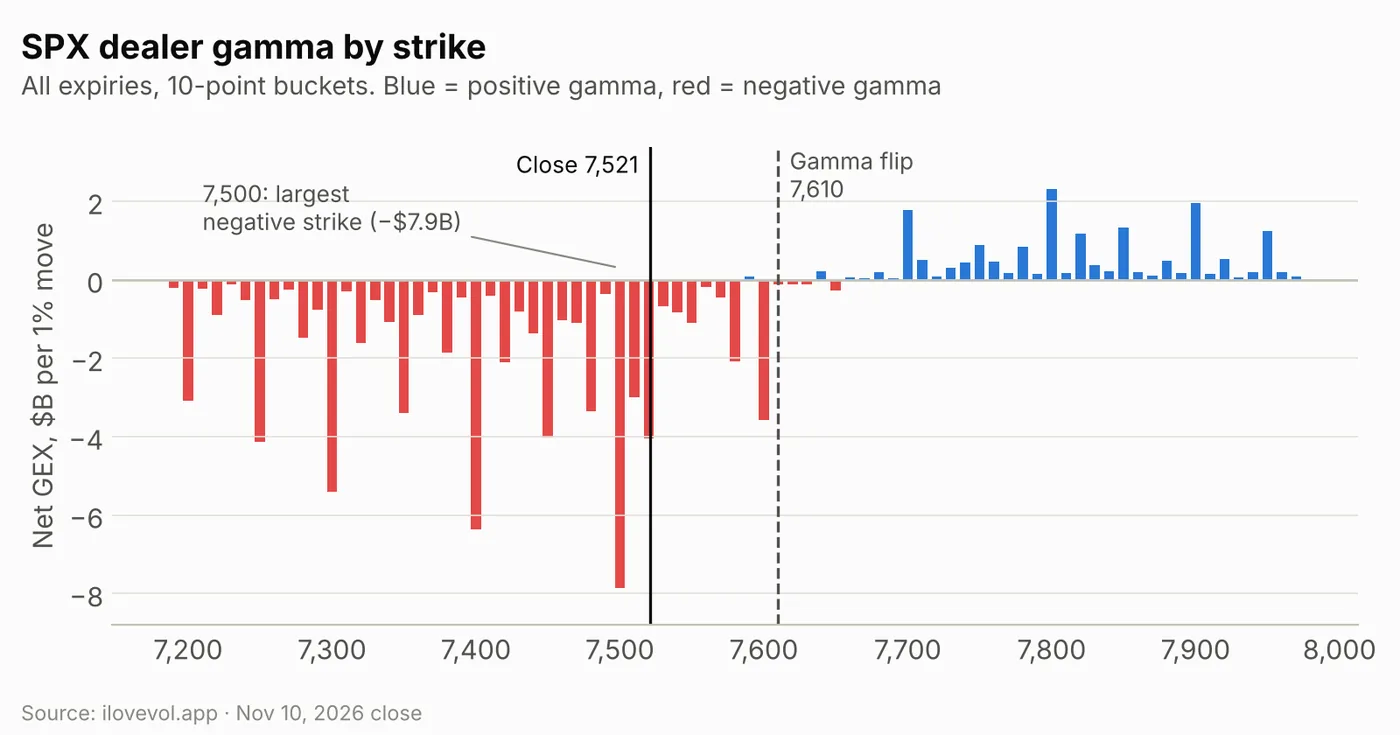
The largest negative bucket is 7,500 (−$7.9B), 21 points below the close, followed by 7,400 (−$6.4B), 7,300 (−$5.4B), 7,250 (−$4.1B) and 7,520 (−$4.1B). The first positive bucket above spot is still 7,590, and the strike map turns mostly positive from about 7,640, with the largest call-side buckets at 7,800 (+$2.3B), 7,900 (+$2.0B) and 7,700 (+$1.8B).
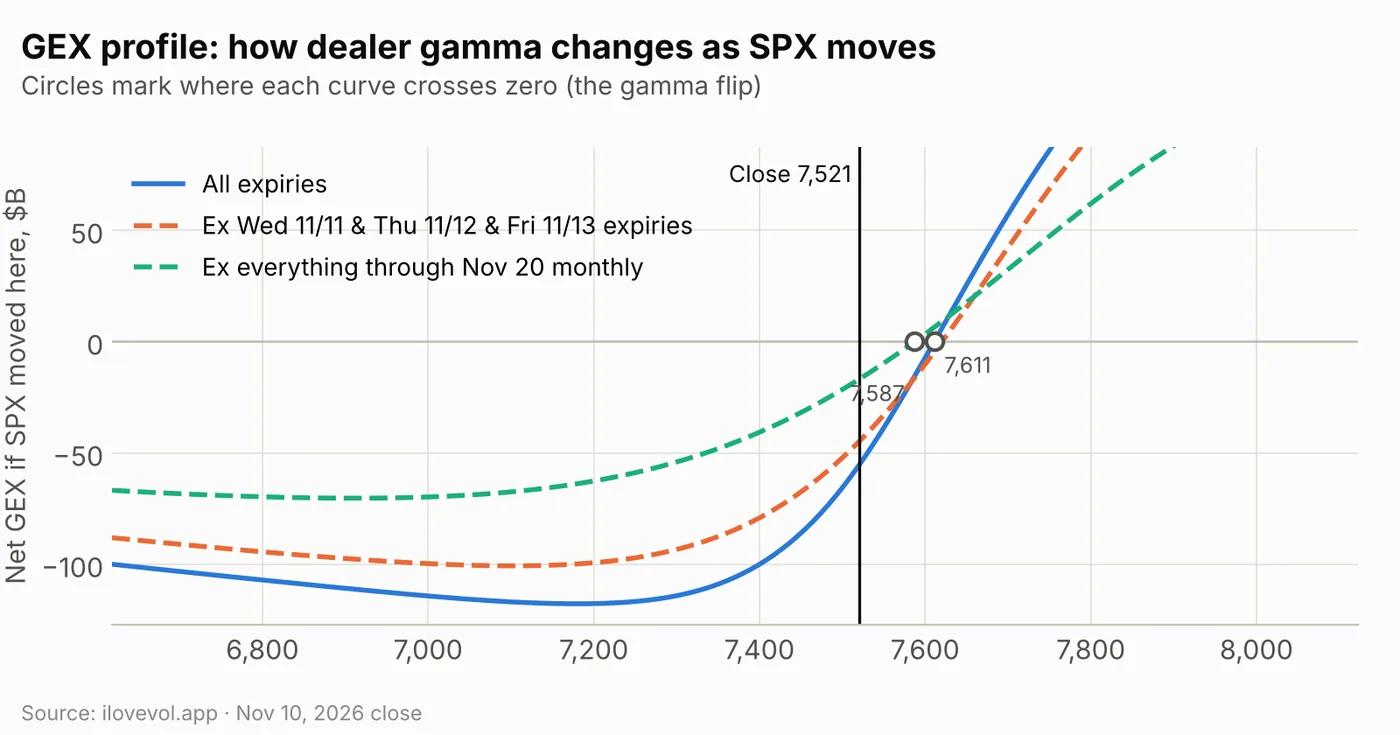
The modeled profile crosses zero near 7,611, matching the site's flip, and reads about −$55B at the close. It stays steep around spot: about −$66B at 7,500 and −$100B at 7,400, against about +$25B at 7,650 and +$45B at 7,680. It bottoms near −$118B around 7,180.
This week's expiries are a minority. Without the Nov 11 to Nov 13 expiries, modeled gamma at spot is about −$45B, with the flip near 7,620.
The longer-dated book turned shorter. Without everything through the Nov 20 monthly, gamma at spot is about −$17B (about −$8.5B on Monday), with a flip near 7,587, 66 points above the close.
Weekly vs monthly: the call wall comes down to 7,550
All three SPX windows grew more negative (numbers in the dealer-gamma table under the scoreboard). Their flips sit between 7,590 and 7,632, 69 to 111 points above the close.
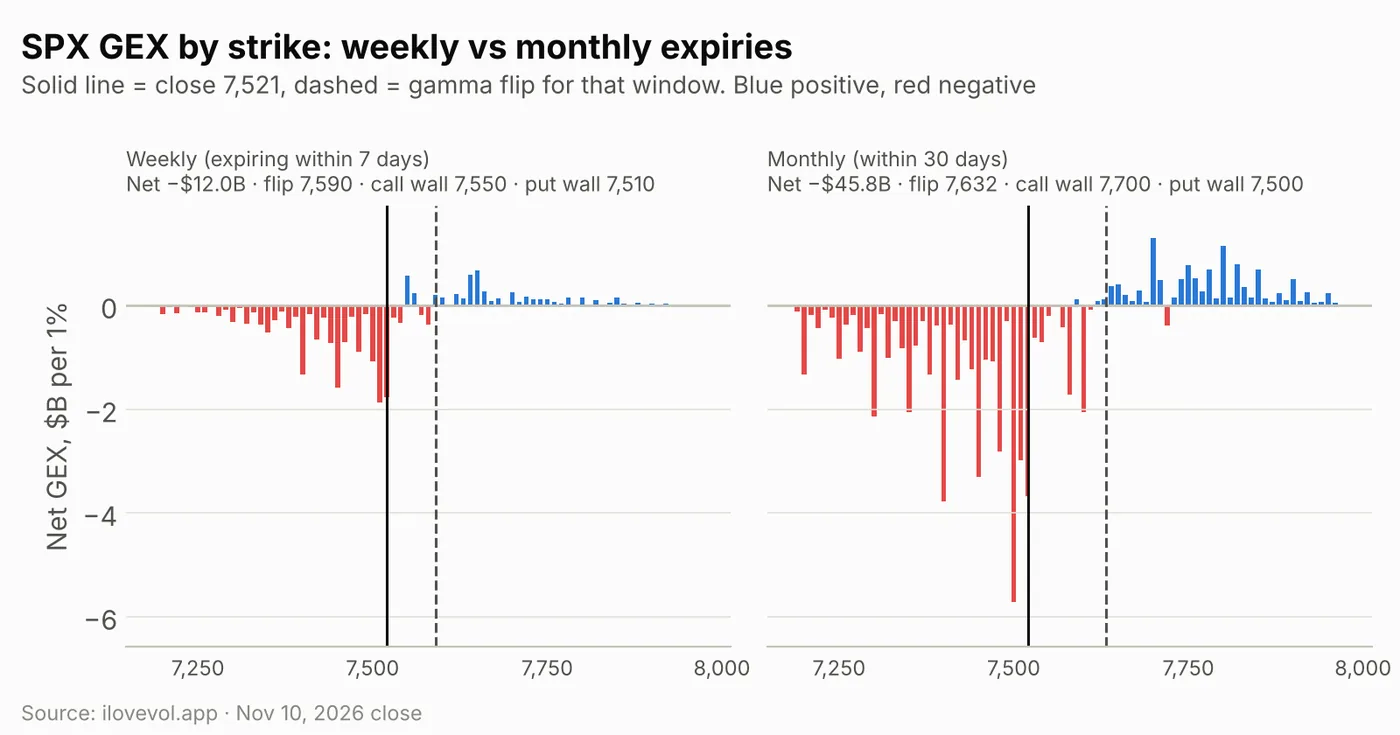
SPX weekly: the next 7 days hold −$12.0B, from −$10.2B, about 23% of the total. The window covers five expiries, Nov 11 to Nov 17, including PPI on Friday and the session of Nvidia's results. Its flip fell to 7,590 from 7,627. The call wall dropped to 7,550 from 7,650, 29 points above the close, and the put wall held at 7,510, 11 points below. The largest weekly buckets bracket spot: 7,510 (−$1.9B) and 7,520 (−$1.8B), then 7,450 (−$1.6B).
SPX monthly: the 30-day window is −$45.8B (−$38.3B on Monday), with the flip at 7,632, the call wall at 7,700 and the put wall at 7,500. Its largest buckets are 7,500 (−$5.7B), 7,400 (−$3.8B) and 7,520 (−$3.7B). That leaves about −$34B in expiries 8–30 days out, which hold the Nov 18 post-Nvidia expiry and the Nov 20 monthly, while everything beyond 30 days now nets to about −$5B, compared with roughly +$0.6B on Monday.
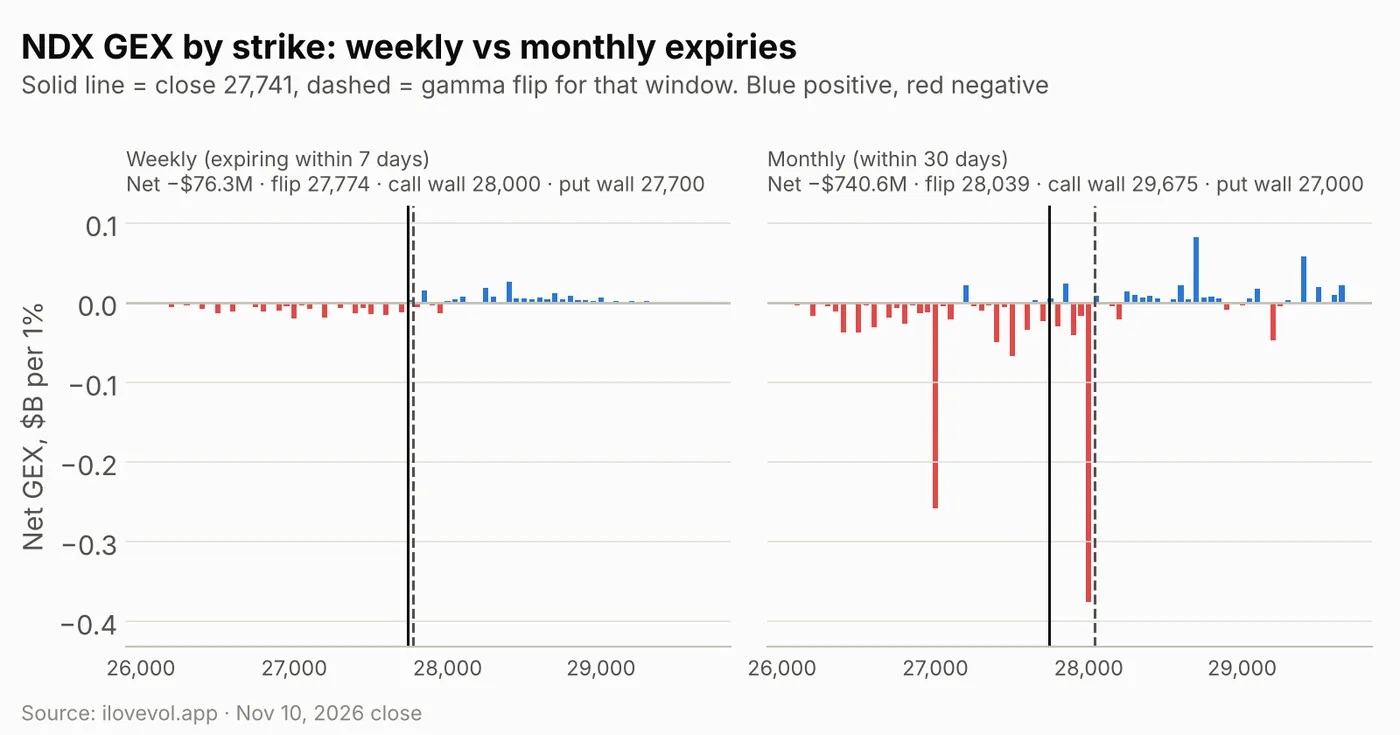
NDX fell 0.60% to 27,741 and its short gamma widened to −$1.33B from −$1.09B. It closed 413 points under its 28,154 flip. Weekly is close to flat at −$0.08B (flip 27,774, call wall 28,000, put wall 27,700), so the close sits between the weekly flip and the put wall. Monthly is −$0.74B (flip 28,039, call wall 29,675, put wall 27,000), with its largest buckets at 28,000 (−$0.38B) and 27,000 (−$0.26B).
RUT fell 0.68% to 2,821 and slipped back into negative gamma, −$0.14B from +$0.21B. It closed 8 points under its 2,829 flip, with the call wall at 2,850 and the put wall at 2,800.
3. The VIX complex: the CPI premium drains out
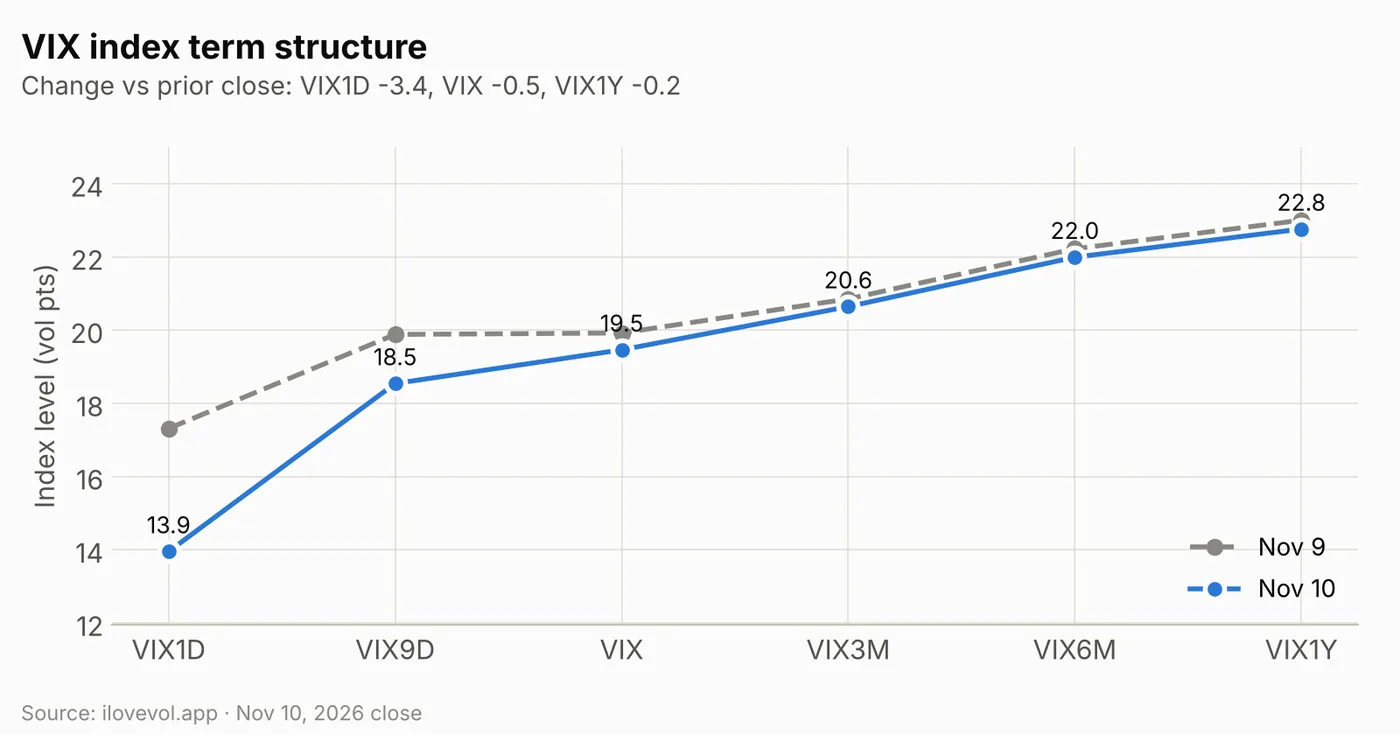
With CPI out of the way, the very front fell hardest. VIX1D dropped 3.36 to 13.95 and VIX9D 1.34 to 18.54, while VIX lost 0.46 to 19.46, VIX3M 0.21 to 20.64, VIX6M 0.23 to 21.99 and VIX1Y 0.24 to 22.76. The index curve slopes upward from one day to one year, and VIX1D now sits 4.6 points under VIX9D.
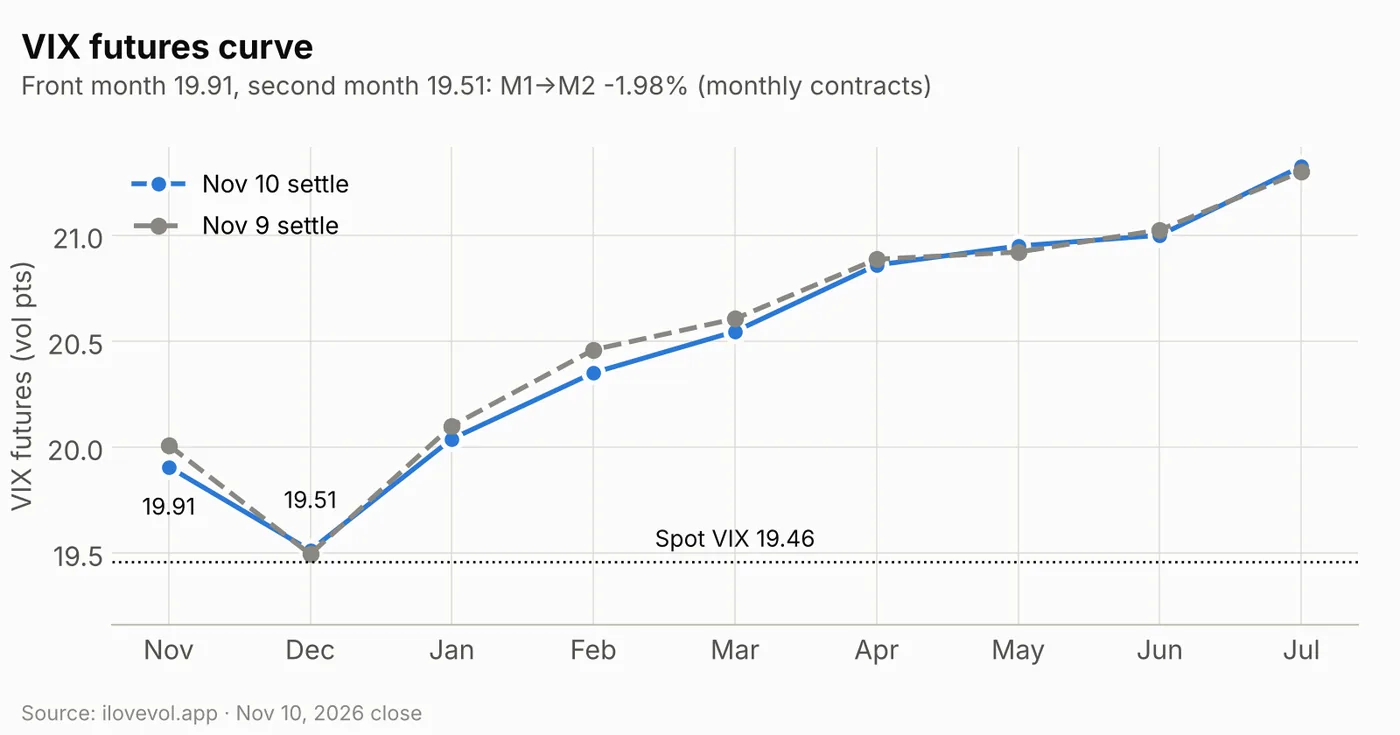
November futures settled at 19.91, down 0.10, and December at 19.51, up 0.02. M1→M2 narrowed to −1.98% from −2.57%: the November contract still sits above December, so the very front stays slightly inverted, but from December on the curve rises, to 20.04 in January and 21.33 in July. November trades 0.45 above spot VIX, and December 0.05 above it. VVIX slipped 1.8 to 96.6.
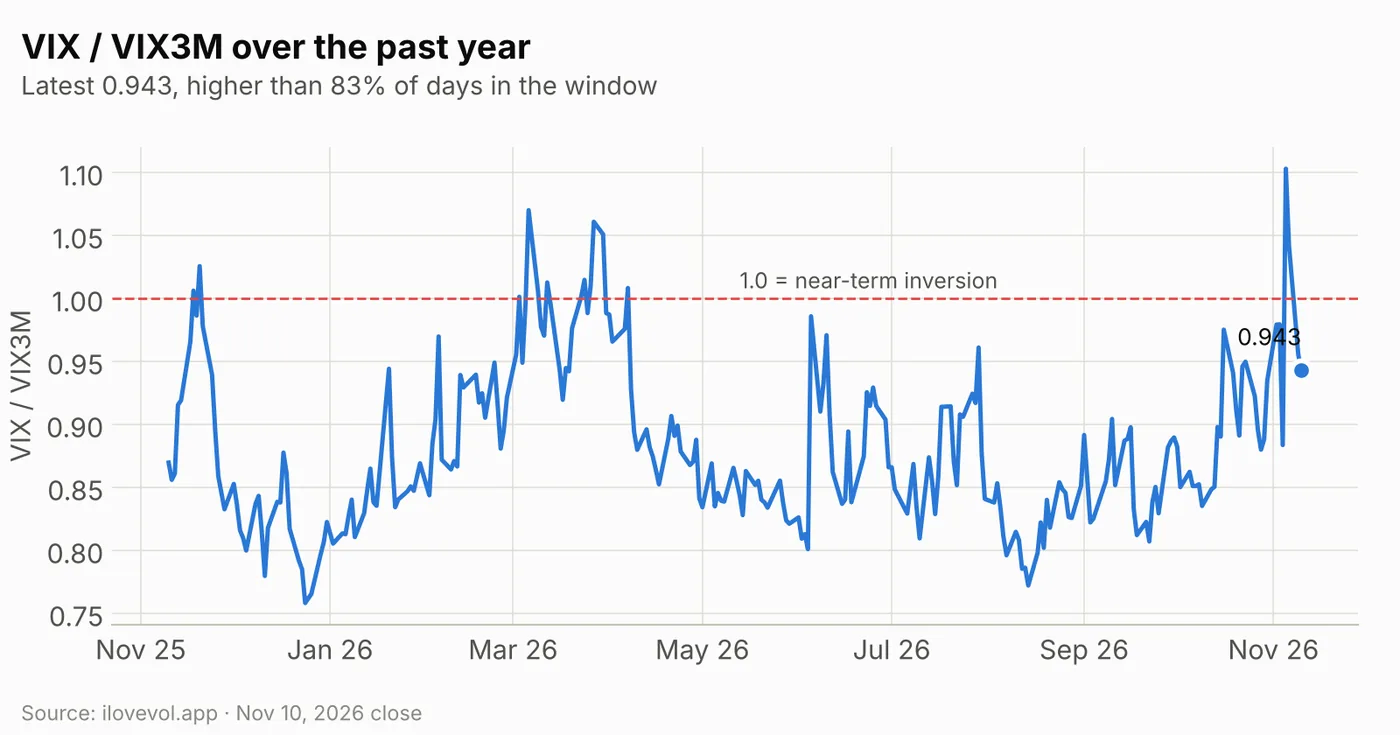
VIX/VIX3M eased to 0.943 from 0.955. It is still higher than 83% of the past year's sessions, so one-month vol remains elevated relative to three months even with the curve in contango.
4. Implied vs realized: VIX still below realized
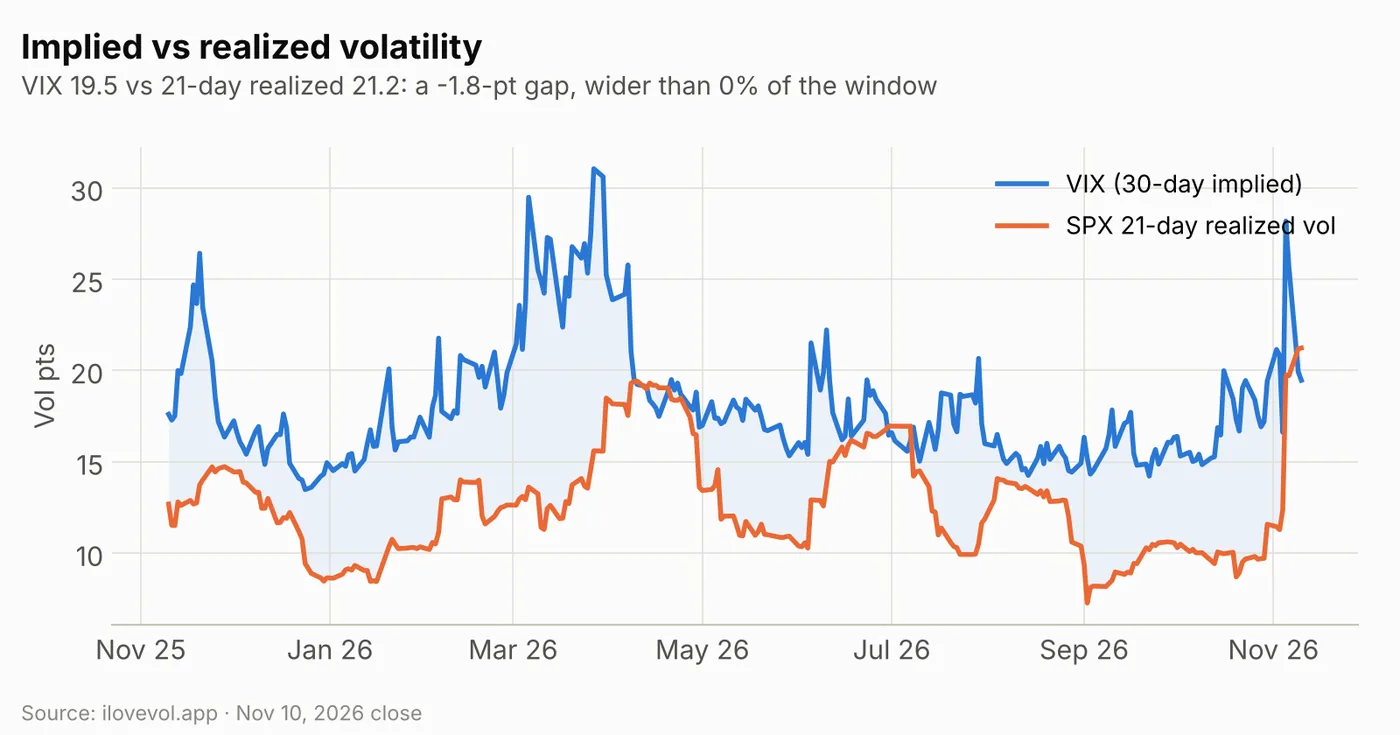
SPX 21-day realized vol was little changed at 21.2. With VIX at 19.5, the gap is −1.8 points: VIX sits below realized, and the spread is the narrowest of any session in the past year. Thirty-day ATM IV (15.2%) is about 6 points under realized. The market keeps pricing a calmer month than the one just delivered; the large moves from Nov 5 and Nov 9 stay in the realized window into early December, so realized vol is unlikely to fall quickly unless the tape stays quiet.
5. SPX surface: flat skew, next premiums are PPI and Nvidia
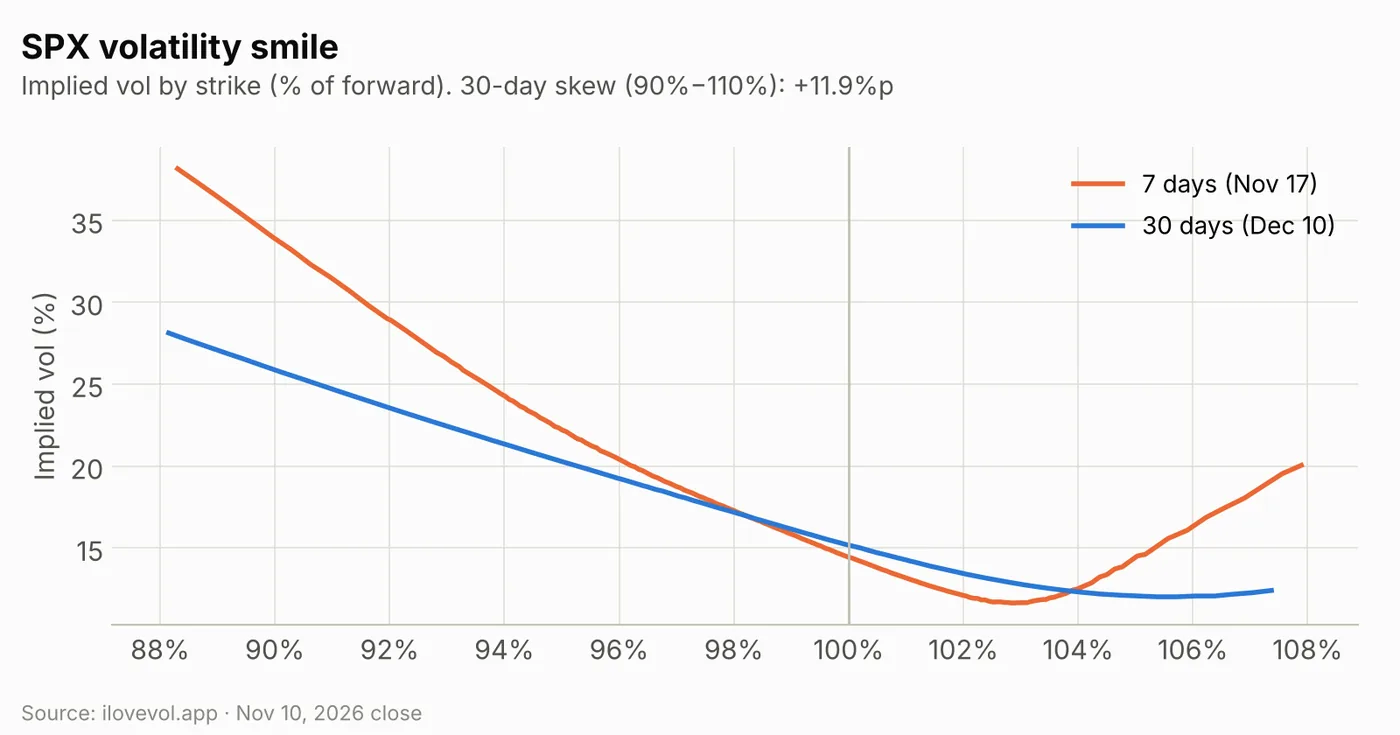
Thirty-day ATM IV edged down to 15.2% from 15.3%, and 30-day skew (90% vs 110%) held at 11.9 points. The 90-day minus 30-day slope is +0.1 points. The 7-day smile (Nov 17) runs from about 38% at 88% of the forward to about 14.5% at the money, bottoms near 11.7% around 103% and curls up to about 20% at 108%. The 30-day curve (Dec 10) runs from about 28% to a floor near 12% around 105–106%.
The expiry table shows where the premium moved. Wednesday's expiry, which carries the CoreWeave reaction, is 15.6% ATM, about 74 points. Thursday is 16.4%, and Friday Nov 13 is 16.8% (PPI, after Cisco and Applied Materials), about 140 points through that day. Nov 16 and Nov 17 drop to 14.1% and 14.5%, then Nov 18, the first expiry after Nvidia, jumps to 15.5%, about 180 points through that day. The Nov 20 monthly is 15.6%, about 210 points.
6. Cross-asset Vol Sentiment: a second small step up
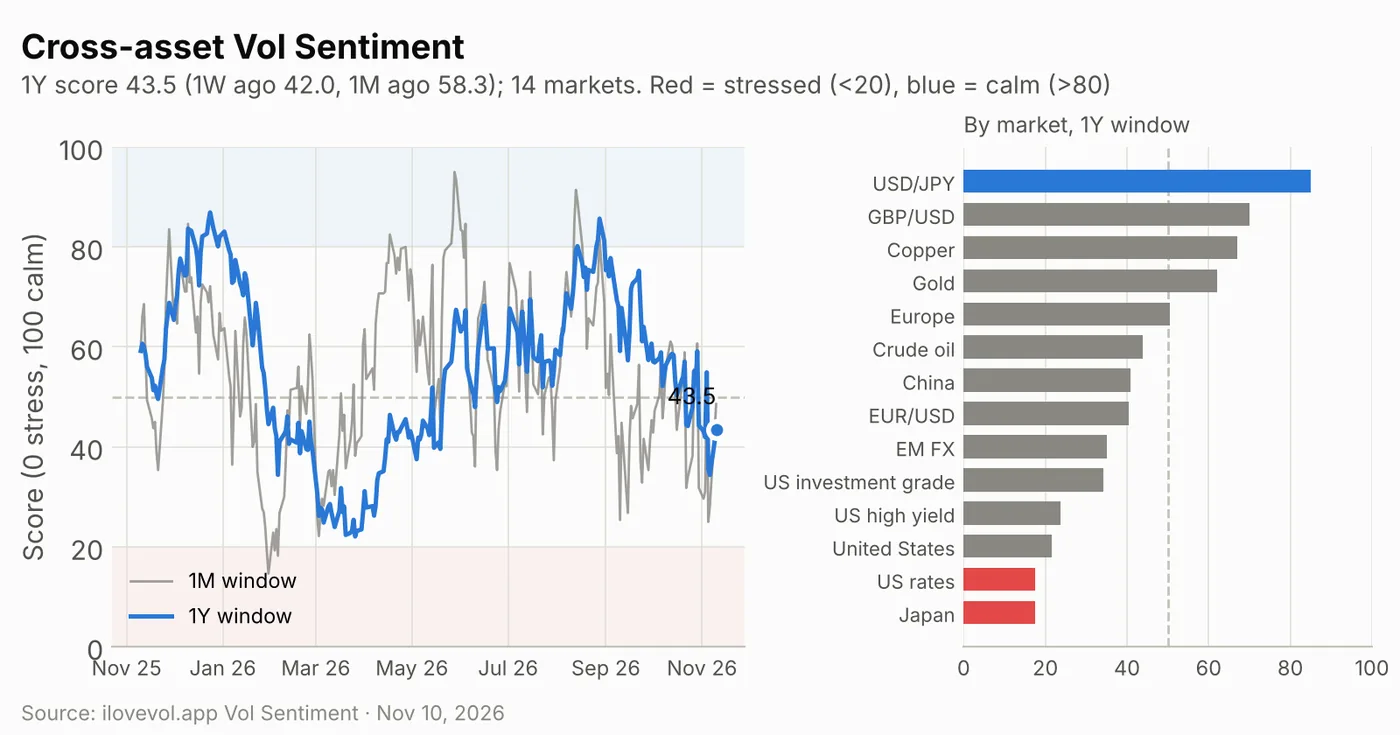
The cross-asset Vol Sentiment score places volatility in 14 equity, currency, rates, credit and commodity markets within its own one-year range (0 = stress, 100 = calm). On the one-year window it rose to 43.5 from 41.0 on Monday (a revised reading). That is still under the 50 midpoint, slightly above 42.0 a week ago but well below 58.3 a month ago, and higher than 27% of the past year's sessions. The shorter windows improved too: 48.6 on one month (43.6 Monday) and 30.6 on three months (27.3).
Only two markets remain in the stressed zone below 20: Japan (17.5) and US rates (17.5), the latter consistent with the 10-year pushing toward 5%. US equities (21.7), US high yield (23.8) and investment grade (34.2) are now just above it. USD/JPY (85.0) is the only calm market, ahead of GBP/USD (70.0), copper (67.1) and gold (62.1). The cross-asset backdrop is still on the stressed side of neutral, and rates vol rather than equity vol is now its weakest link. It is context, not a trading signal.
Calendar: the week ahead
Economic data & Fed
| Date | Time (ET) | Event | Note |
|---|---|---|---|
| Wed Nov 11 | – | Veterans Day: stocks open, bond market closed | No major US data |
| Thu Nov 12 | 8:30 | Jobless claims | Existing home sales at 10:00 |
| Thu Nov 12 | Through the day | Fed speakers: Hammack, Goolsbee, Daly, Schmid, Williams | After Waller and Logan leaned hawkish |
| Thu Nov 12 | 13:00 | 30-year bond auction | First long-end test with the 10-year near 5% |
| Fri Nov 13 | 8:30 | PPI (Oct) | Nov 13 expiry 16.8% ATM, about 140 pts through Fri |
| Fri Nov 13 | Through the day | Fed speakers: Collins, Bowman, Daly | |
| Tue Nov 17 | 8:30 | Retail sales (Oct), import prices | Industrial production at 9:15; Nov 17 expiry 14.5% |
| Wed Nov 18 | 8:30 | Housing starts (Oct) | |
| Wed Nov 18 | 14:00 | FOMC minutes (Oct 27–28 meeting) | Next FOMC decision Dec 9 |
| Thu Nov 19 | 8:30 | Jobless claims |
Earnings
| Date | Timing | Companies | Note |
|---|---|---|---|
| Tue Nov 10 | After close | CoreWeave | Reaction in the Nov 11 expiry (15.6% ATM) |
| Thu Nov 12 | Before open | Nebius | |
| Thu Nov 12 | After close | Cisco, Applied Materials | Reaction in the Nov 13 expiry (16.8% ATM) |
| Fri Nov 13 | Before open | Alibaba (expected) | |
| Tue Nov 17 | Before open | Home Depot (expected) | |
| Tue Nov 17 | After close | Nvidia | Nov 18 expiry 15.5% ATM vs 14.5% Nov 17 |
| Wed Nov 18 | Before open | Target, Lowe's (expected) | |
| Thu Nov 19 | Before open | Walmart (expected) |
Volatility dates (expirations, events)
| Date | Event | Note |
|---|---|---|
| Wed Nov 11 | First SPX expiry after CPI and CoreWeave | 15.6% ATM, about 74 pts; VIX1D 13.95 |
| Fri Nov 13 | Weekly SPX expiry with PPI | 16.8% ATM, about 140 pts through Nov 13 |
| Wed Nov 18 | First SPX expiry after Nvidia | 15.5% ATM, about 180 pts through Nov 18 |
| Wed Nov 18 | VIX November futures and options expiration | Nov future 19.91, 0.45 above spot VIX (19.46) |
| Fri Nov 20 | SPX November monthly expiration | 15.6% ATM, about 210 pts; most of the short gamma expires by then |
| Thu Nov 26 / Fri Nov 27 | Thanksgiving (closed) / 1:00 pm early close |
What I'm watching
- 7,590 to 7,632. The weekly flip (7,590), the all-expiry flip (7,610) and the monthly flip (7,632). The profile turns positive quickly above it (about +$25B at 7,650), so a close through this band would put dealers back in long gamma.
- 7,500 to 7,510. The weekly put wall (7,510) and the largest negative strike (7,500, −$7.9B), 11–21 points under the close. Below them are 7,400 (−$6.4B) and 7,300 (−$5.4B), and the profile sinks toward −$100B by 7,400.
- The weekly call wall at 7,550. It dropped from 7,650 and sits 29 points above the close; with short gamma on both sides of spot, it is the nearest upside reference this week.
- Realized vs implied. 21-day realized vol 21.2 vs VIX 19.5 and 30-day ATM IV 15.2%: the narrowest VIX-minus-realized spread of the past year. Either the tape quiets down or implied vol has room to reprice.
- Event premiums. Friday's PPI expiry is 16.8% ATM (about 140 points through Nov 13) and the post-Nvidia Nov 18 expiry 15.5% against 14.5% for Nov 17. CPI's 90-point premium delivered 29; watch whether these get sold the same way.
Sources
- TheStreet: Stock Market Today (Nov. 10, 2026): Nasdaq falls after key inflation report derails strong start to week
- Yahoo Finance: Stock market today: Dow, S&P 500, Nasdaq slip as hot CPI fuels rate hike odds, Nvidia stock sinks
- StockTitan: The Stock Market Today, November 10, 2026
- FXEmpire: The Week Ahead: CPI and Tech Earnings Test a Fragile Stock Market
- Xoomar: US Economic Calendar
- FedRateCalc: November 2026 U.S. Economic Calendar
- StoneX: Weekly equities outlook: Cisco, CoreWeave, ITV
- TheStreet Pro: Earnings, week of Nov 16 – Nov 20
- NVIDIA IR: Conference Call for Third-Quarter Financial Results
- Macroption: VIX Expiration Calendar 2026
Volatility data: ilovevol.app. GEX assumes dealers are long calls and short puts. VIX futures use settlement prices. Implied moves are approximations from expiry ATM IV over the trading sessions to expiry. Vol Sentiment: ilovevol.app cross-asset score (0 = stress, 100 = calm), one-year window unless noted; day-over-day changes use the latest (revised) prior row.
This review is for informational and educational purposes only and is not investment advice. See the disclaimer.
The Daily Vol sends this review to your inbox each trading day: dealer gamma levels, the VIX curves, the SPX vol surface and the levels to watch. Free, one click to unsubscribe.