Home › Blog › Daily Market Review
Daily Market Review · US close
SPX jumps 2.3% and dealers' short gamma halves, but realized vol now runs above VIX
SPX rose 2.35% to 7,550, its best day since April, and net GEX shrank from −$85.8B to −$37.7B. VIX fell 5.72 to 19.92 and its curve is no longer inverted, but 21-day realized vol (21.2) now sits above it. October CPI is due Tuesday.
- Oil fell nearly 6% after President Trump said renewed strikes on Iran were highly unlikely if talks progress, and stocks rallied broadly: SPX +2.35% to 7,550, NDX +3.40%, the Russell 2000 +3.15%. AMD rose 13.3%; Nvidia fell 4.3% after its board opened an investigation into its CEO.
- Net GEX shrank from −$85.8B to −$37.7B, and SPX closed 74 points under its 7,624 flip, down from 240 on Friday. The weekly put wall is 7,510 and the weekly call wall 7,650; the largest negative strike, 7,500 (−$6.7B), is 50 points below.
- VIX fell 5.72 to 19.92 and VIX1D 11.42 to 17.31. VIX/VIX3M dropped back under 1.0 (0.955). But 21-day realized vol rose to 21.2, above VIX, and 30-day ATM IV is 15.3%. Tuesday's CPI expiry prices about 90 points.
Scoreboard
| Close | Chg | Prev | |
|---|---|---|---|
| SPX | 7,550 | +2.35% | 7,377 |
| NDX | 27,908 | +3.40% | 26,990 |
| VIX | 19.92 | −5.72 | 25.64 |
| VIX1D | 17.31 | −11.42 | 28.73 |
| VVIX | 98.4 | −23.5 | 121.9 |
| VX Nov / Dec | 20.01 / 19.49 | −2.57% M1→M2 | −6.38% |
| VIX / VIX3M | 0.955 | −0.087 | 1.042 |
| 30D ATM IV / skew | 15.3% / 11.9 | −4.1 / −5.1 | 19.4% / 17.0 |
| Window | Net GEX | Chg | Prev | Flip | Call wall | Put wall | |
|---|---|---|---|---|---|---|---|
| SPX | All | −$37.7B | +$48.1B | −$85.8B | 7,624 | 8,000 | 7,000 |
| SPX | Weekly | −$10.2B | +$12.5B | −$22.7B | 7,627 | 7,650 | 7,510 |
| SPX | Monthly | −$38.3B | +$26.4B | −$64.7B | 7,655 | 7,700 | 7,500 |
| NDX | All | −$1.09B | +$1.46B | −$2.55B | 28,307 | 29,000 | 27,000 |
| NDX | Weekly | −$0.15B | +$0.51B | −$0.66B | 28,101 | 28,000 | 27,500 |
| NDX | Monthly | −$0.60B | +$1.03B | −$1.63B | 28,216 | 29,675 | 27,000 |
Dealer gamma by expiry window. All = every listed expiry; Weekly = contracts expiring within 7 calendar days; Monthly = within 30 days. Net GEX in $ per 1% move.
1. The tape: lower oil, a broad rebound, and Nvidia the exception
The S&P 500 rose 173 points (2.35%) to 7,550, its best day since April and its second straight gain, leaving it 3.4% below last month's record. The Dow added 1,104 points (2.2%) to 52,390, the Nasdaq Composite 2.7% to 25,253 and the Nasdaq-100 3.40% to 27,908. The Russell 2000 gained 3.15% to 2,841. Last week's selloff had been driven by worries that the midterm results could slow AI data-center construction and by the cost of financing the build-out.
Oil set the tone. Brent fell 5.8% to about $92.57 after President Trump said on CNN that resuming strikes on Iran was highly unlikely if negotiations progress; it was above $112 at the start of the month. Lower fuel costs lifted United Airlines (+5.9%) and Carnival (+4%). Small caps, semiconductors, airlines, industrials and consumer discretionary led, Reuters reported. AMD rose 13.3% after an Oppenheimer upgrade, CoreWeave 5.6% and Constellation Energy 10.5% after beating profit and revenue forecasts and highlighting data-center power deals.
Nvidia was the notable decliner, down 4.3%, after its board opened an investigation into CEO Jensen Huang following a New York Times report; the board said it had no reason to believe national security or company secrets were compromised. The 10-year Treasury yield held near 4.87%, gold rose about 1.7%, Europe's STOXX 600 gained 1.3% and Japan's Nikkei 2.3%. Reuters noted that futures priced a higher chance of a December Fed rate hike.
Why it matters for vol: Friday's surface priced about 81 points for Monday's session; SPX moved 173. An up day counts as realized vol too: SPX 21-day realized vol rose to 21.2 and now sits above VIX. Implied vol was cut hard on the rally, but delivered vol has not come down yet, and CPI is the first test.
2. Dealer gamma: less than half as short, still under the flip
Net GEX across all expiries shrank to −$37.7B per 1% move from −$85.8B. The flip edged up to 7,624 from 7,617, and SPX closed 74 points (1.0%) under it, compared with 240 points on Friday. Dealers are still short gamma, but much less so.
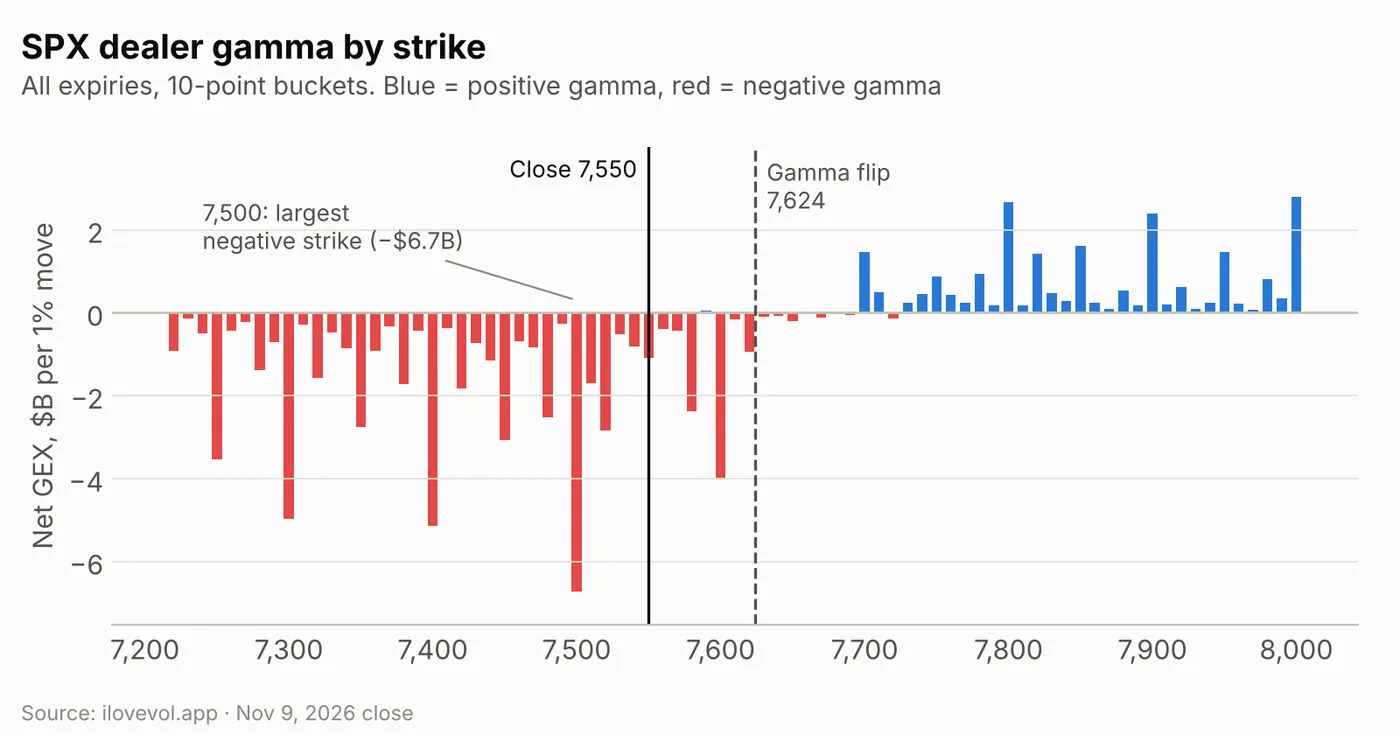
The rally carried SPX through the 7,400 cluster and up to just above the largest negative bucket, 7,500 (−$6.7B). The other big negative strikes are 7,400 (−$5.2B), 7,300 (−$5.0B), 7,600 (−$4.0B) and 7,250 (−$3.5B). The first positive bucket above spot is 7,590, and the strike map is mostly positive from about 7,700, with the largest call-side buckets at 8,000 (+$2.8B), 7,800 (+$2.7B) and 7,900 (+$2.4B).
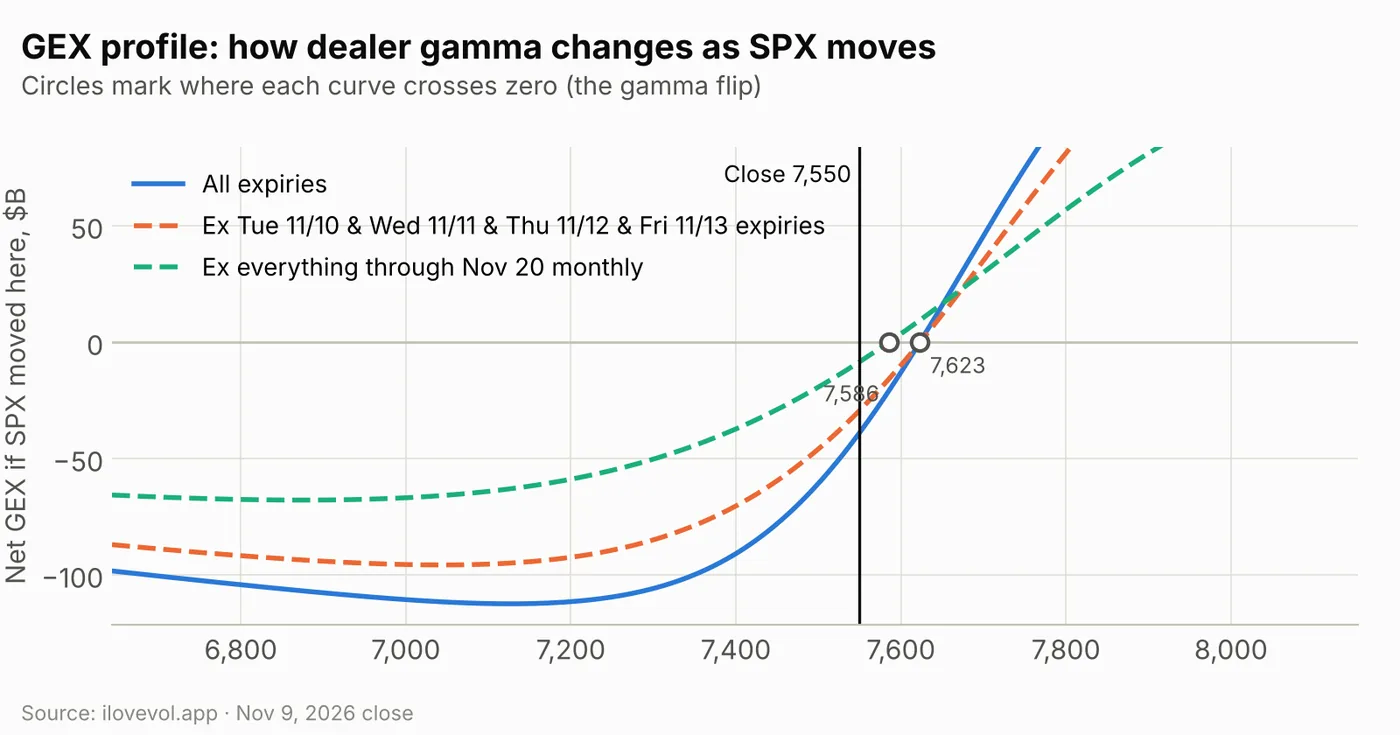
The modeled profile crosses zero near 7,623, matching the site's flip, and reads about −$39B at the close. It is steep around spot: about −$63B near 7,490 and about +$35B near 7,680. Below 7,400 it flattens out near −$105B to −$112B.
This week's expiries are a minority. Without the Nov 10 to Nov 13 expiries, modeled gamma at spot is about −$29B, with the flip still near 7,624.
The longer-dated book is close to flat. Without everything through the Nov 20 monthly, gamma at spot is about −$8.5B (about −$34B on Friday), with a flip near 7,586, just 36 points above the close. Most of the remaining short gamma expires by Nov 20.
Weekly vs monthly: short gamma sits in the next 30 days
All three SPX windows shrank sharply (numbers in the dealer-gamma table under the scoreboard). Their flips sit in a 31-point band, 7,624 to 7,655, between 74 and 105 points above the close.
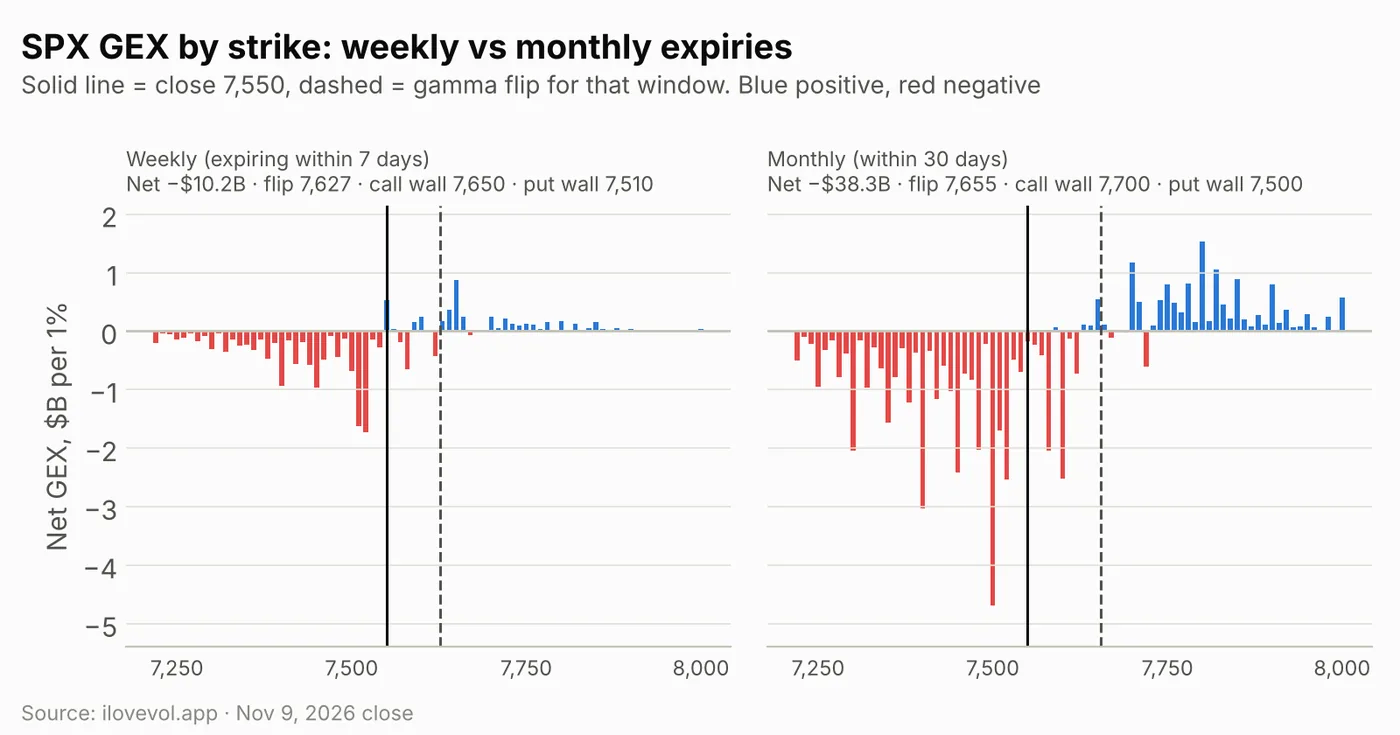
SPX weekly: the next 7 days hold −$10.2B, from −$22.7B, about 27% of the total. The window covers five expiries, Nov 10 to Nov 16, including CPI on Tuesday and PPI on Friday. Its flip is 7,627. The call wall rose to 7,650 from 7,500 and the put wall to 7,510 from 7,350, 40 points under the close. The largest weekly buckets sit just below spot, at 7,520 (−$1.7B) and 7,510 (−$1.6B); 7,550 and 7,650 are small positive buckets.
SPX monthly: the 30-day window is −$38.3B (−$64.7B on Friday), with the flip at 7,655, the call wall at 7,700 and the put wall at 7,500. Its largest buckets are 7,500 (−$4.7B), 7,400 (−$3.0B) and 7,520 (−$2.5B). That leaves about −$28B in expiries 8–30 days out, which cover Nvidia's results and the Nov 20 monthly, while everything beyond 30 days nets to roughly zero (about +$0.6B), compared with about −$21B on Friday.
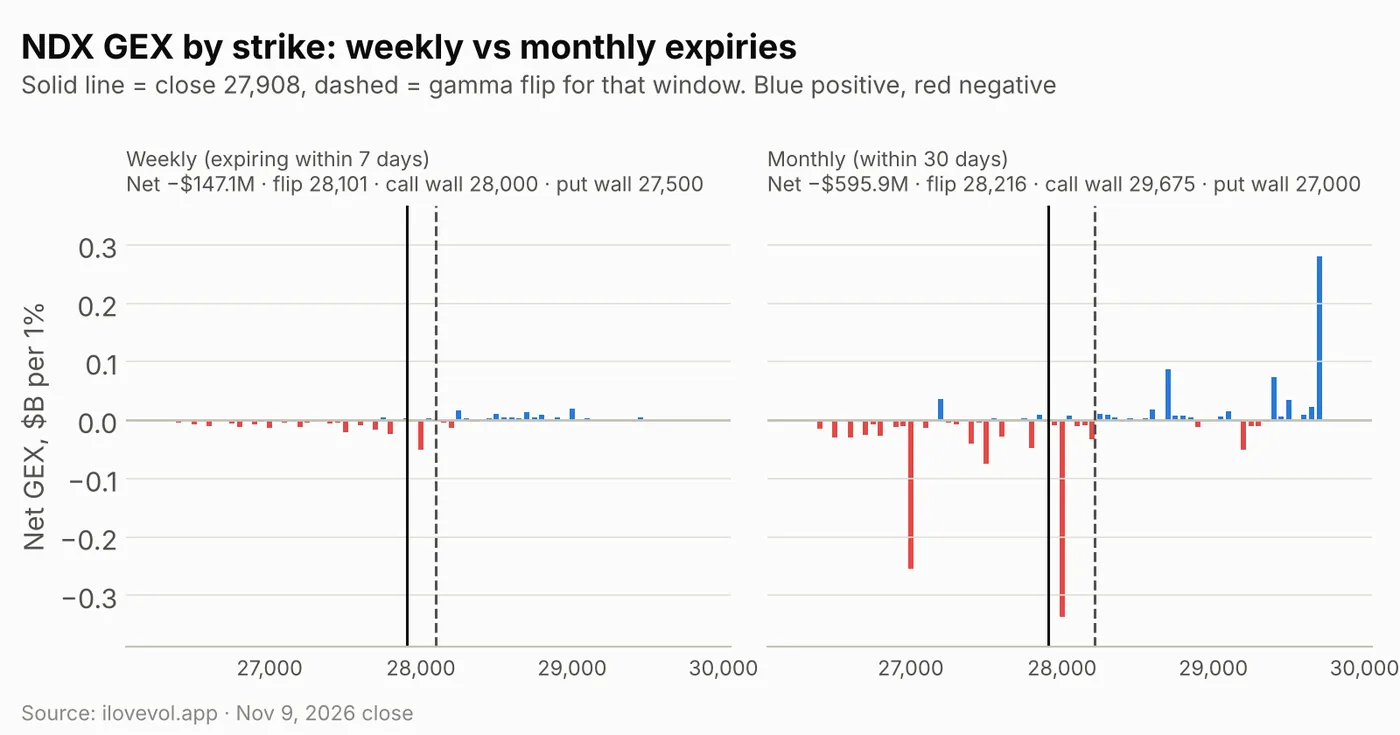
NDX jumped 3.40% to 27,908 despite Nvidia's drop, and its short gamma shrank to −$1.09B from −$2.55B. It closed 399 points under its 28,307 flip. Weekly is nearly flat at −$0.15B (flip 28,101, call wall 28,000, put wall 27,500); the 28,000 call wall is 92 points above the close. Monthly is −$0.60B (flip 28,216, call wall 29,675, put wall 27,000), with its largest buckets at 28,000 (−$0.34B) and 27,000 (−$0.26B) and the largest positive one at 29,700 (+$0.28B).
RUT rose 3.15% to 2,841 and moved into positive gamma, +$0.21B from −$2.03B. It closed 4 points above its 2,837 flip, with the call wall at 2,850 and the put wall at 2,800.
3. The VIX complex: the inversion is gone
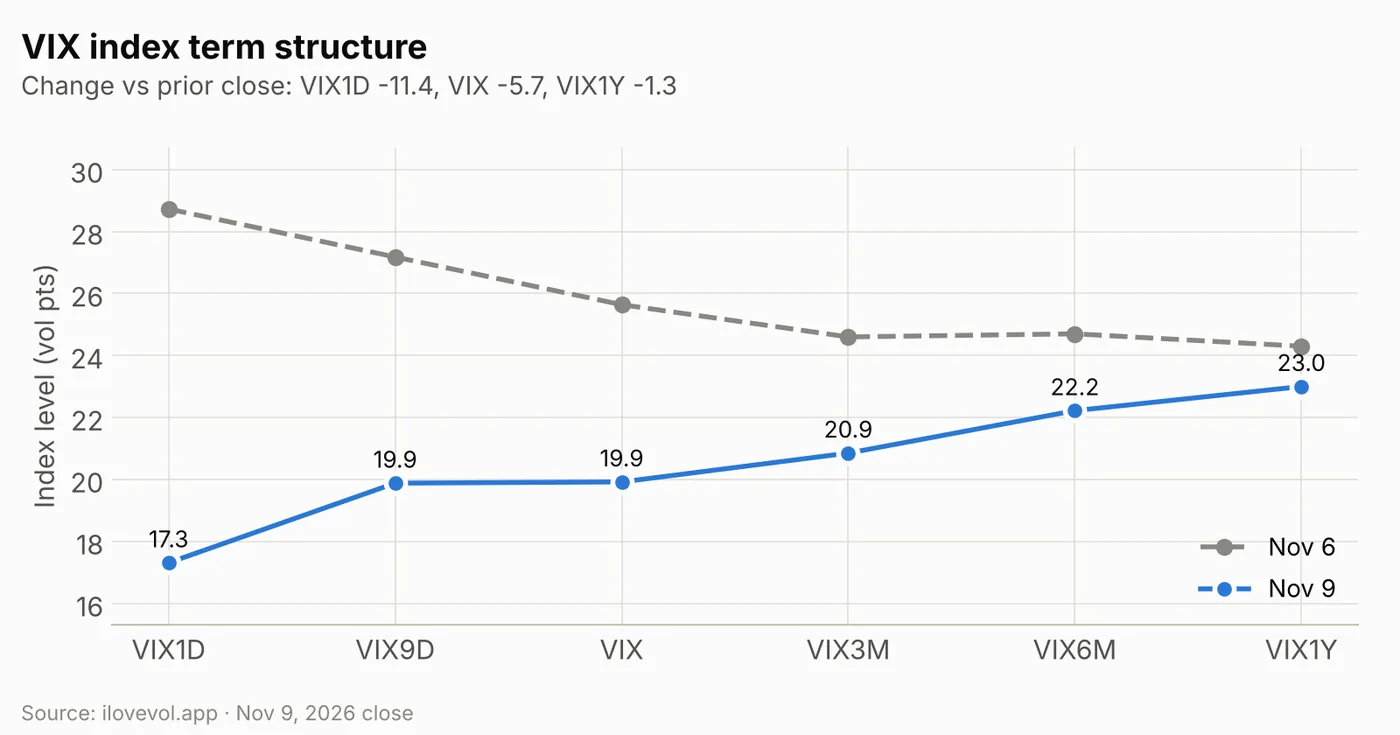
The front end collapsed. VIX1D fell 11.42 to 17.31, VIX9D 7.30 to 19.88 and VIX 5.72 to 19.92, while VIX3M lost 3.75 to 20.85, VIX6M 2.48 to 22.22 and VIX1Y 1.30 to 23.00. The index curve now slopes upward all the way from one day to one year, after sloping down through three months on Friday. VIX1D, which now covers Tuesday's CPI session, is 2.6 points under VIX9D.
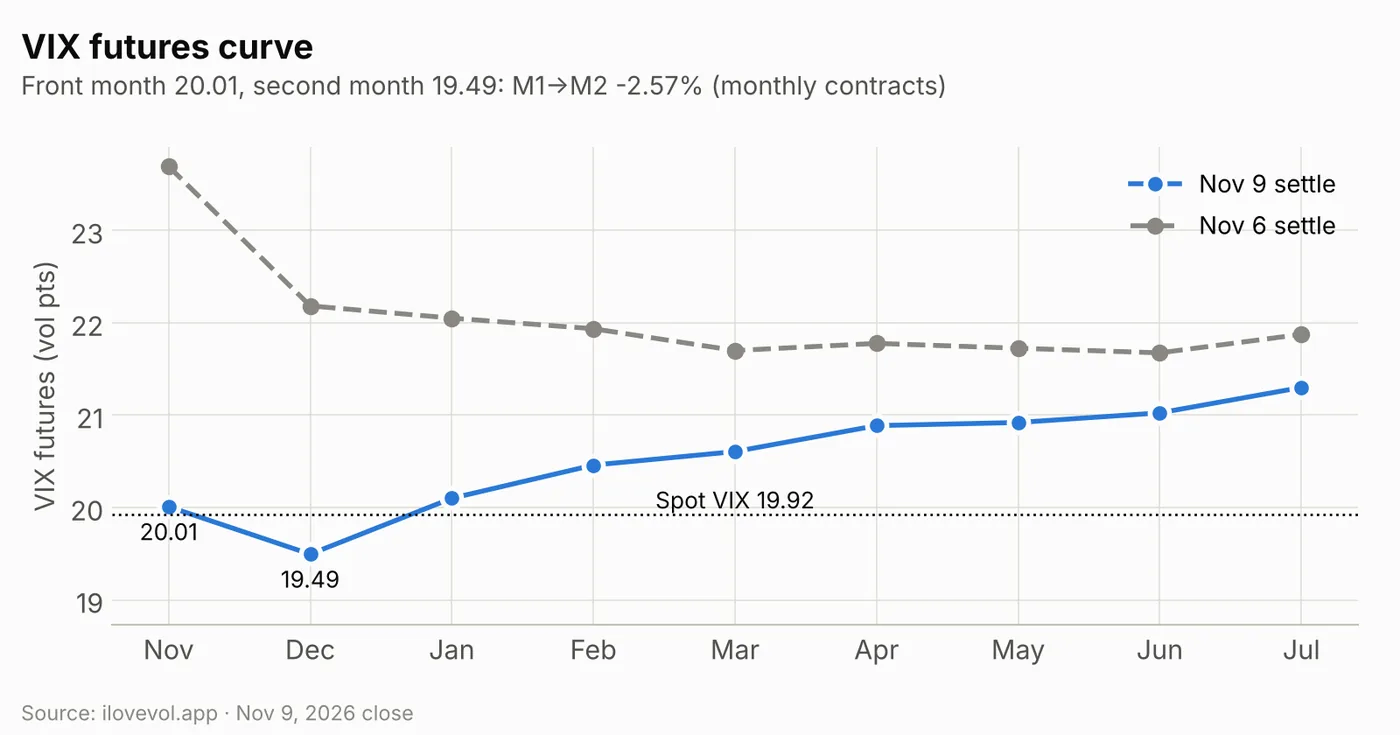
November futures settled at 20.01, down 3.69, and December at 19.49, down 2.69. M1→M2 narrowed to −2.57% from −6.38%, so the very front is still slightly inverted, but from December on the curve rises: January 20.10, rising to 21.30 in July. November now sits 0.09 above spot VIX, after trading 1.95 below it on Friday. VVIX fell 23.5 to 98.4, back under 100.
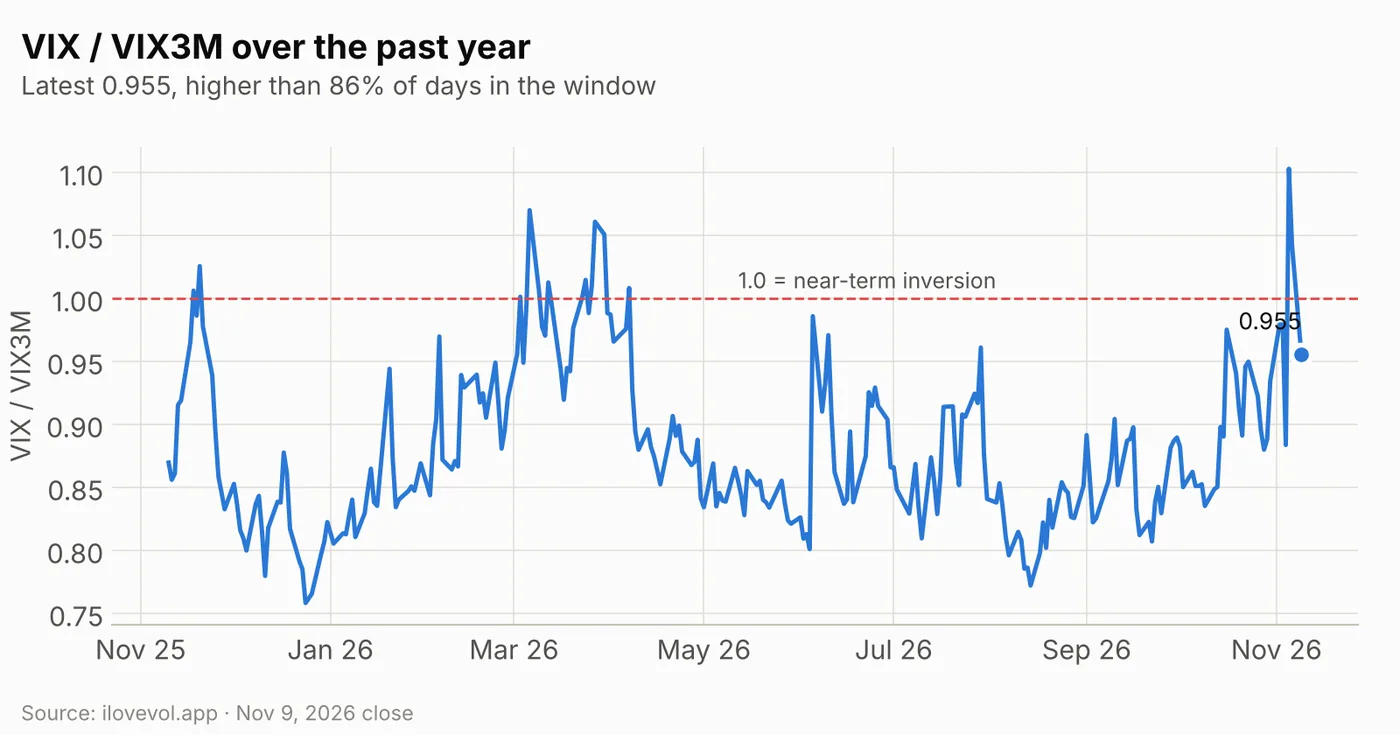
VIX/VIX3M fell to 0.955 from 1.042, back under the 1.0 inversion line after two inverted closes. It is still higher than 86% of the past year's sessions, so the near term remains elevated relative to three months.
4. Implied vs realized: realized now runs above VIX
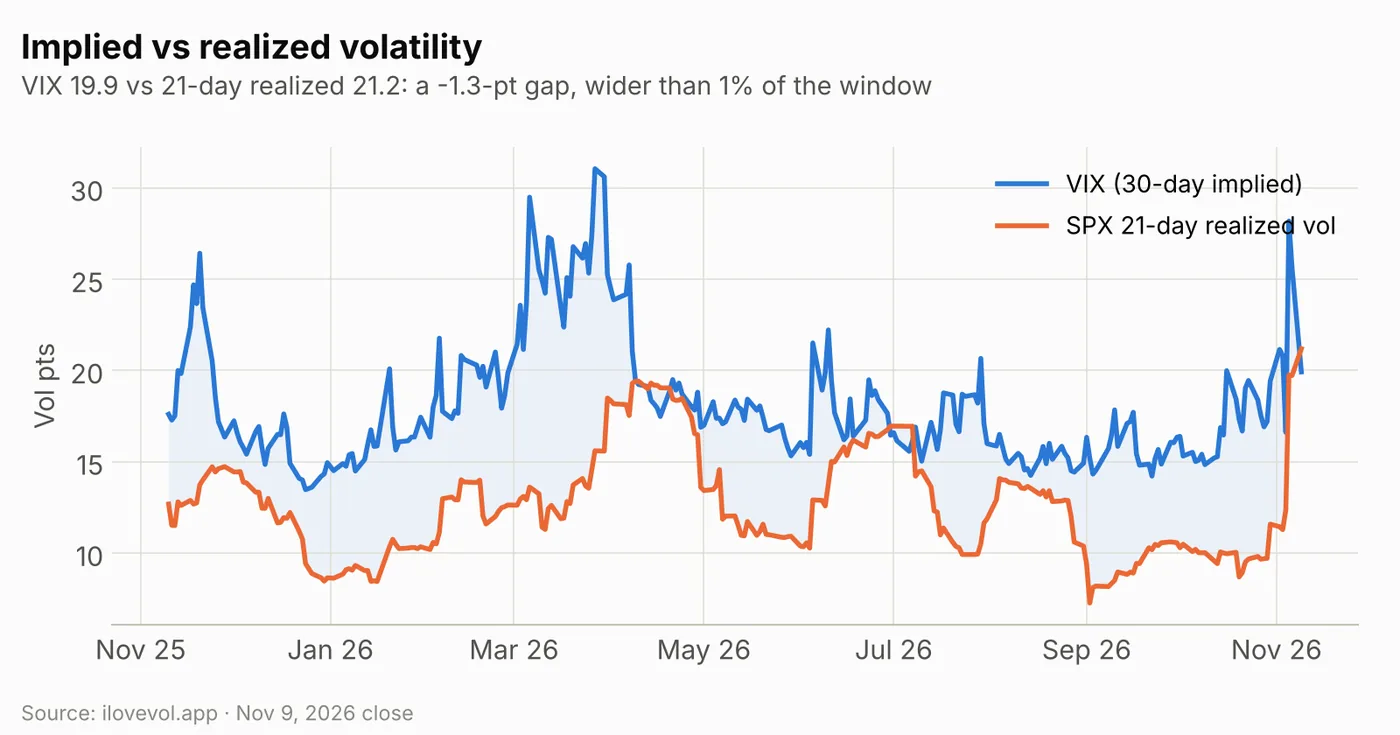
SPX 21-day realized vol rose to 21.2 from 19.7 as Monday's 2.35% gain joined last week's large moves in the window. With VIX at 19.9, the gap is −1.3 points: VIX is below realized, and the spread is narrower than on 99% of the past year's sessions. Thirty-day ATM IV (15.3%) is about 6 points under realized. The options market is pricing a calmer month than the last one; the large moves from Nov 5 and Nov 9 stay in the realized window into early December.
5. SPX surface: skew flattens, the CPI premium shrinks
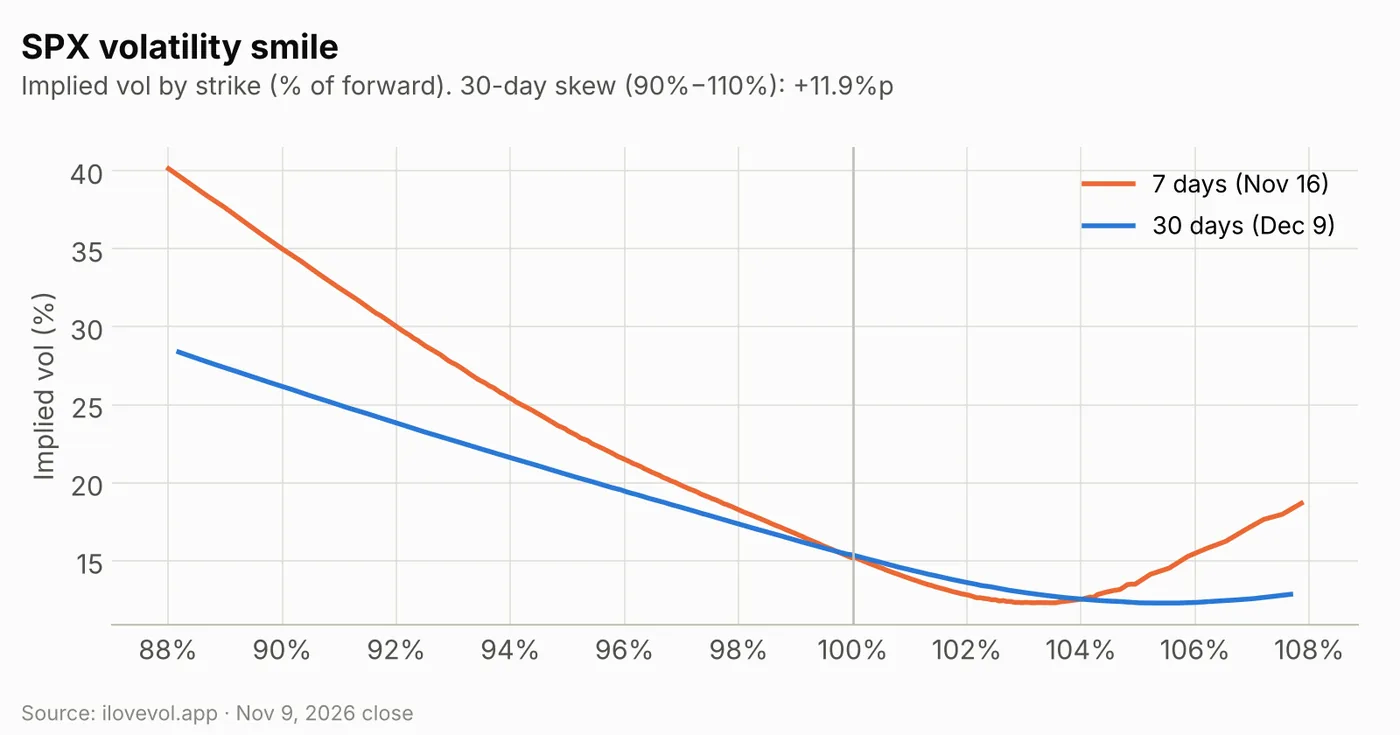
Thirty-day ATM IV fell to 15.3% from 19.4%, and 30-day skew (90% vs 110%) flattened to 11.9 points from 17.0. The 90-day minus 30-day slope turned positive at +0.2 points, from −1.2. The 7-day smile (Nov 16) runs from about 40% at 88% of the forward to about 15.5% at the money, bottoms near 12.5% around 103–104% and curls up to about 19% at 108%. The 30-day curve (Dec 9) runs from about 28.5% to a floor near 12.5% around 105%.
The expiry table shows the event premium. Tuesday's CPI expiry is 19.0% ATM, about 90 points for the session, compared with 20.9% on Friday. ATM IV is 17.8–18.1% for Wednesday and Thursday and 17.9% for Friday Nov 13 (PPI, after Cisco and Applied Materials), about 170 points through that day. It drops to 15.3% for Nov 16, rises to 16.3% for Nov 18, the first expiry after Nvidia's results, and the Nov 20 monthly is 16.1%, about 230 points through expiry.
6. Cross-asset Vol Sentiment: a small step back from the lows
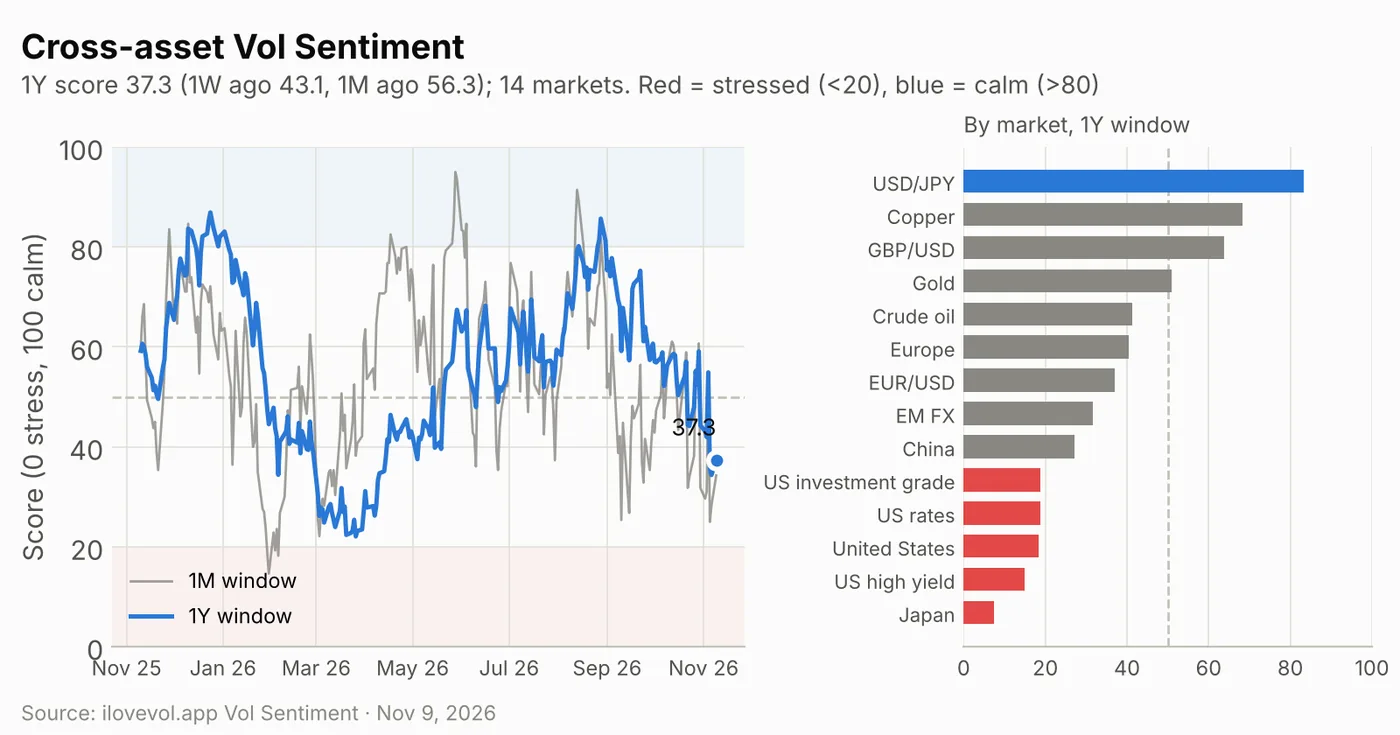
The cross-asset Vol Sentiment score places volatility in 14 equity, currency, rates, credit and commodity markets within its own one-year range (0 = stress, 100 = calm). On the one-year window it rose to 37.3 from 34.4 on Friday (a revised reading). That is still well under the 50 midpoint, below 43.1 a week ago and 56.3 a month ago, and higher than only 13% of the past year's sessions. The shorter windows also improved: 34.3 on one month (28.2 Friday) and 22.6 on three months (20.1).
Five markets remain in the stressed zone below 20: Japan (7.5), US high yield (15.0), US equities (18.3, up from 5.0), US rates (18.8) and investment grade (18.8). China (27.1) moved out of it. USD/JPY (83.3) is the only calm market, ahead of copper (68.3) and GBP/USD (63.8). The SPX vol complex repriced much faster than the broader backdrop: US equity vol is barely out of the stressed zone on a one-year view, and credit and rates vol remain near the top of their ranges. It is context, not a trading signal.
Calendar: the week ahead
Economic data & Fed
| Date | Time (ET) | Event | Note |
|---|---|---|---|
| Tue Nov 10 | 6:00 | NFIB small business optimism (Oct) | |
| Tue Nov 10 | 8:30 | October CPI | m/m only, no y/y; Nov 10 expiry 19.0% ATM, about 90 pts |
| Tue Nov 10 | 13:00 | 10-year note auction | Waller and Bowman speak |
| Wed Nov 11 | – | Veterans Day: stocks open, bond market closed | |
| Thu Nov 12 | 6:30 | NY Fed President Williams speaks | |
| Thu Nov 12 | 8:30 | Jobless claims | |
| Thu Nov 12 | 10:00 | Existing home sales (Oct) | |
| Thu Nov 12 | 13:00 | 30-year bond auction | |
| Fri Nov 13 | 8:30 | PPI (Oct) | Nov 13 expiry 17.9% ATM, about 170 pts through Fri |
| Tue Nov 17 | 8:30 | Retail sales (Oct) | Industrial production at 9:15 |
| Wed Nov 18 | 14:00 | FOMC minutes (Oct 27–28 meeting) | Next FOMC decision Dec 9 |
Earnings
| Date | Timing | Companies | Note |
|---|---|---|---|
| Tue Nov 10 | After close | CoreWeave | Reaction in the Nov 11 expiry (18.1% ATM) |
| Thu Nov 12 | Before open | Nebius, Brookfield | |
| Thu Nov 12 | After close | Cisco, Applied Materials, Cerebras | Reaction in the Nov 13 expiry (17.9% ATM) |
| Fri Nov 13 | Before open | Alibaba (expected) | |
| Tue Nov 17 | Before open | Home Depot (expected) | |
| Tue Nov 17 | After close | Nvidia | Nov 18 expiry 16.3% ATM vs 15.6% Nov 17 |
Volatility dates (expirations, events)
| Date | Event | Note |
|---|---|---|
| Tue Nov 10 | SPX expiry on CPI day | 19.0% ATM, about 90 pts; VIX1D 17.3 |
| Fri Nov 13 | Weekly SPX expiry with PPI | 17.9% ATM, about 170 pts through Nov 13 |
| Wed Nov 18 | First SPX expiry after Nvidia | 16.3% ATM, about 205 pts through Nov 18 |
| Wed Nov 18 | VIX November futures and options expiration | Nov future 20.01, 0.09 above spot VIX (19.92) |
| Fri Nov 20 | SPX November monthly expiration | 16.1% ATM, about 230 pts; most remaining short gamma expires by then |
| Thu Nov 26 / Fri Nov 27 | Thanksgiving (closed) / 1:00 pm early close |
What I'm watching
- 7,624 to 7,655. The all-expiry flip (7,624), the weekly flip (7,627), the weekly call wall (7,650) and the monthly flip (7,655). The profile turns positive quickly above this band (about +$35B near 7,680), so a close above it would put dealers back in long gamma.
- 7,500 to 7,510. The weekly put wall (7,510) and the largest negative strike (7,500, −$6.7B), 40–50 points under the close. Below it are 7,400 (−$5.2B) and 7,300 (−$5.0B), and the profile sinks toward −$110B.
- The CPI premium. Tuesday's expiry prices about 90 points (19.0% ATM) and VIX1D is 17.3. Friday's surface priced about 81 points for Monday and SPX moved 173; another move well beyond the priced range would push realized vol higher.
- Realized vs implied. 21-day realized vol 21.2 vs VIX 19.9 and 30-day ATM IV 15.3%. Either the tape calms down or implied vol has room to be repriced higher.
- The front of the VIX curve. VIX/VIX3M 0.955, November 20.01 over December 19.49 (M1→M2 −2.57%), VVIX 98.4. A full return to contango through December would confirm the reset before the Nov 18 VIX expiration.
Sources
- AP via TV News Check: Dow Jumps 1,104; Nasdaq Climbs 674; S&P 500 Adds 173
- AP via BNN Bloomberg: U.S. stocks rally and claw back more of last week's losses as oil prices swing lower
- Reuters via AOL: Trading Day: Broad rebound rally lifts all boats but Nvidia
- Yahoo Finance: Stock market today: Nasdaq surges despite Nvidia stock slide, Dow and S&P 500 rally as AI tech trade rises
- Regards of Wall Street: Stock Market Week Ahead (Nov 9-13)
- SimianX: US Economic Calendar November 2026
- BLS: Schedule of Releases for November 2026
- Federal Reserve: November 2026 calendar
- StockTitan: Earnings calendar, week of November 9, 2026
- NVIDIA IR: Conference Call for Third-Quarter Financial Results
- Macroption: VIX Expiration Calendar 2026
Volatility data: ilovevol.app. GEX assumes dealers are long calls and short puts. VIX futures use settlement prices. Implied moves are approximations from expiry ATM IV over the trading sessions to expiry. Vol Sentiment: ilovevol.app cross-asset score (0 = stress, 100 = calm), one-year window unless noted; day-over-day changes use the latest (revised) prior row.
This review is for informational and educational purposes only and is not investment advice. See the disclaimer.
The Daily Vol sends this review to your inbox each trading day: dealer gamma levels, the VIX curves, the SPX vol surface and the levels to watch. Free, one click to unsubscribe.