Home › Blog › Daily Market Review
Daily Market Review · US close
SPX steadies after a payrolls beat, but dealers stay deeply short gamma and VIX stays inverted
SPX rose 0.31% to 7,377 as chips bounced, but it closed 240 points under its 7,617 flip with net GEX at −$85.8B. VIX fell 2.54 to 25.64 and VIX1D dropped 8.07, yet VIX/VIX3M (1.042) is still above 1.0. CPI on Tuesday is the next test.
- October payrolls rose 165,000, far above the roughly 59,000 expected, and chip stocks recovered part of Thursday's rout. SPX +0.31% to 7,377, NDX +1.35%, the Dow −0.46%. AMD gained 11.0% and Intel 7.7%. SPX still lost 2.7% on the week.
- Net GEX improved from −$95.2B to −$85.8B, but SPX closed 240 points under its 7,617 flip. The close sits between the two largest negative strikes, 7,400 (−$6.4B) and 7,300 (−$6.2B). The weekly put wall stays at 7,350 and the weekly call wall dropped to 7,500.
- The jobs-day expiry priced about 167 points; SPX moved 23. VIX1D fell 8.07 to 28.73 and VIX 2.54 to 25.64, but the curve is still inverted: VIX/VIX3M 1.042, M1→M2 −6.38%. The Nov 10 CPI expiry prices 20.9% ATM vs 17.5% for Monday.
Scoreboard
| Close | Chg | Prev | |
|---|---|---|---|
| SPX | 7,377 | +0.31% | 7,354 |
| NDX | 26,990 | +1.35% | 26,630 |
| VIX | 25.64 | −2.54 | 28.18 |
| VIX1D | 28.73 | −8.07 | 36.80 |
| VVIX | 121.9 | −13.1 | 135.0 |
| VX Nov / Dec | 23.69 / 22.18 | −6.38% M1→M2 | −9.55% |
| VIX / VIX3M | 1.042 | −0.061 | 1.103 |
| 30D ATM IV / skew | 19.4% / 17.0 | −2.1 / −1.3 | 21.5% / 18.3 |
| Window | Net GEX | Chg | Prev | Flip | Call wall | Put wall | |
|---|---|---|---|---|---|---|---|
| SPX | All | −$85.8B | +$9.4B | −$95.2B | 7,617 | 8,000 | 7,000 |
| SPX | Weekly | −$22.7B | +$3.0B | −$25.7B | 7,613 | 7,500 | 7,350 |
| SPX | Monthly | −$64.7B | +$5.2B | −$69.9B | 7,657 | 7,700 | 7,000 |
| NDX | All | −$2.55B | +$0.74B | −$3.29B | 28,272 | 28,000 | 26,000 |
| NDX | Weekly | −$0.66B | +$0.29B | −$0.95B | 28,099 | 28,000 | 26,000 |
| NDX | Monthly | −$1.63B | +$0.55B | −$2.18B | 28,236 | 27,500 | 26,000 |
Dealer gamma by expiry window. All = every listed expiry; Weekly = contracts expiring within 7 calendar days; Monthly = within 30 days. Net GEX in $ per 1% move.
1. The tape: a strong jobs report and a partial chip rebound
The S&P 500 rose 0.31% to 7,377, the Nasdaq Composite gained 1.09% to 24,579 and the Nasdaq-100 1.35% to 26,990, while the Dow slipped 237 points (0.46%) to 51,286. The Russell 2000 added 0.89% to 2,754. For the week, the S&P 500 lost 2.7%, its worst week since June, and the Nasdaq Composite 3.4%.
The October jobs report was much stronger than expected. Payrolls rose 165,000 against a consensus near 59,000, and unemployment was 4.1% versus 4.2% expected. The University of Michigan's preliminary November sentiment index rose to 51.0 from 48.0, above forecasts. Treasury yields moved higher after the data, with the 10-year near 4.86%, and Reuters reported that futures put the odds of a December rate hike above 65%.
Chips led the bounce. AMD rose 11.0%, Lam Research 8.2% after approving a $25 billion buyback, Intel 7.7% and Nvidia 2.8%; by StockTitan's count the big chip names won back about a third of Thursday's losses. President Trump said he fully supports the AI build-out. Among earnings movers, Airbnb rose 11.7% on 19% revenue growth and a new buyback of up to $12 billion, Cloudflare about 10% and Moderna 5.3%; DraftKings fell 21%, Axon 18% and Atlassian 16%. Overseas, the Nikkei entered a bear market and Korea's Kospi fell more than 6% earlier in the day.
Why it matters for vol: Thursday's expiry priced about 64 points and SPX moved 335; Friday's priced about 167 and SPX closed 23 points higher. The front end deflated accordingly, but dealer positioning barely changed: they remain short about $86B of gamma, and the close sits right inside the densest negative strikes going into a week with CPI, PPI and major AI-infrastructure earnings.
2. Dealer gamma: a little less short, still far below the line
Net GEX across all expiries improved to −$85.8B per 1% move from −$95.2B. The flip slipped to 7,617 from 7,634, and SPX closed 240 points (3.3%) under it, down from 280 points on Thursday.
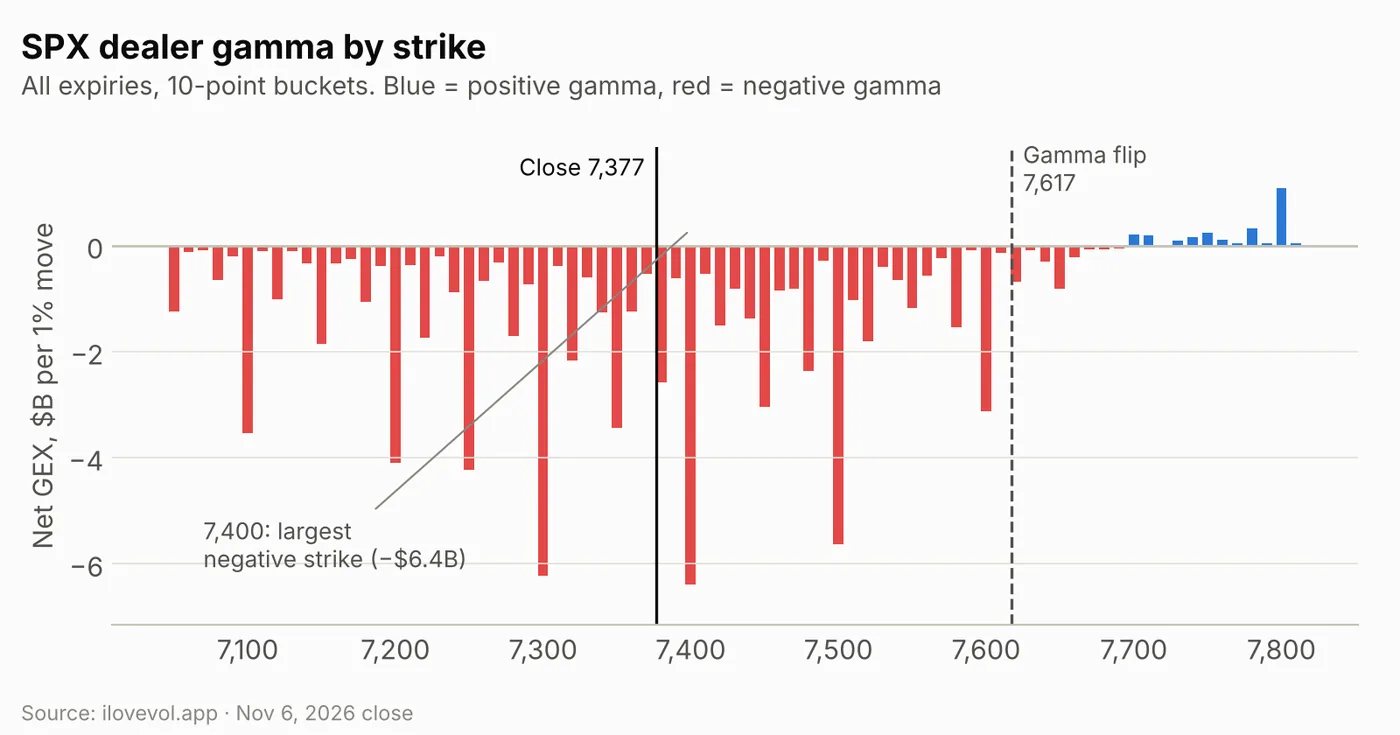
The strike map is almost the same as Thursday's. The largest negative buckets are 7,400 (−$6.4B), 7,300 (−$6.2B) and 7,500 (−$5.6B), followed by 7,250 (−$4.2B), 7,200 (−$4.1B) and 7,000 (−$4.0B). The close at 7,377 sits between the two largest, 23 points under 7,400. The first positive bucket is 7,700 and the largest positive one is 7,800 (+$1.1B), so there is little call-side gamma anywhere near spot.
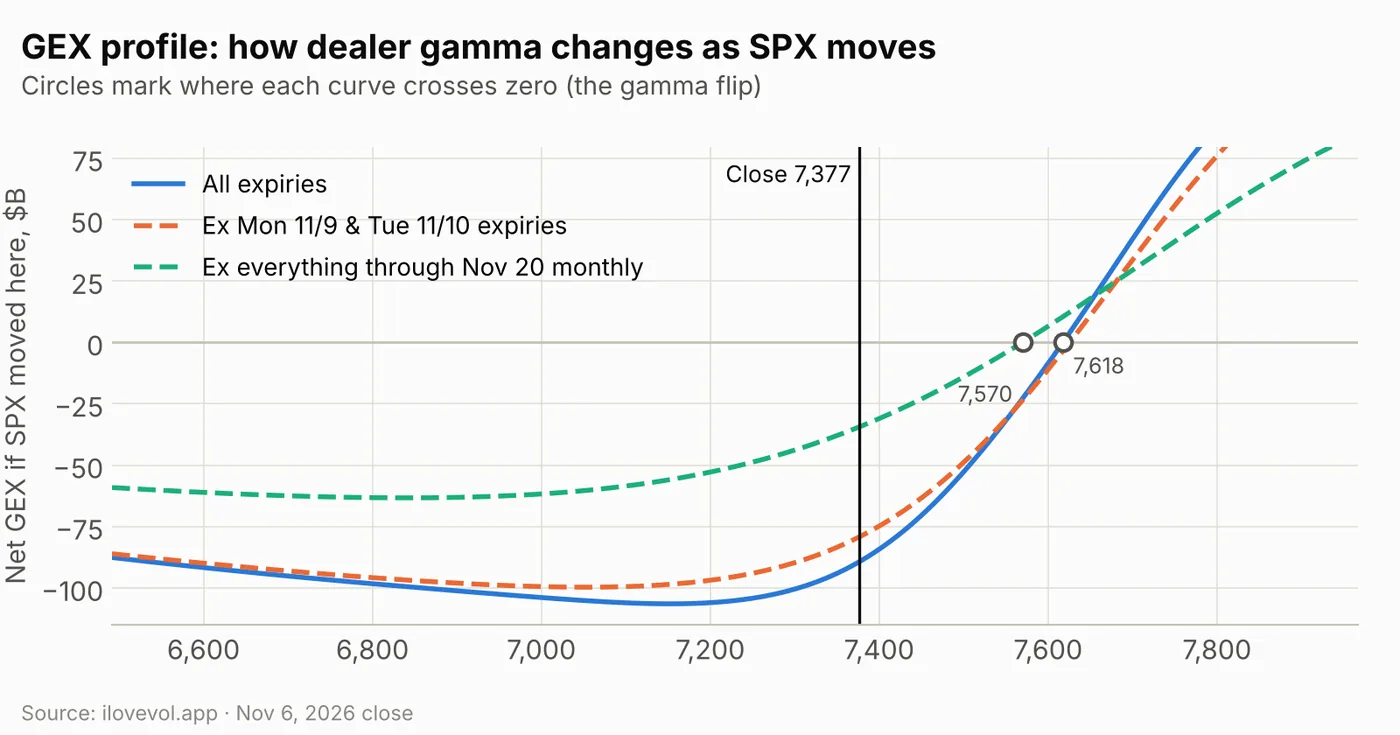
The modeled profile crosses zero near 7,618, matching the site's flip, and reads about −$89B at the close. It keeps falling below spot to a low near −$106B around 7,150 and only climbs steeply above 7,500.
Monday's and Tuesday's expiries are a small part of it. Without the Nov 9 and Nov 10 expiries, modeled gamma at spot is still about −$79B, with a flip near 7,626.
The longer-dated book is short as well. Without everything through the Nov 20 monthly, gamma at spot is about −$34B with a flip near 7,570, 193 points above the close. That curve was about −$35B on Thursday, so the late-dated positioning has not moved.
Weekly vs monthly: short gamma sits mostly 8–30 days out
All three SPX windows are less negative than on Thursday but still deeply short (numbers in the dealer-gamma table under the scoreboard). Their flips sit between 7,613 and 7,657, so the close is 236–280 points below every window's flip.
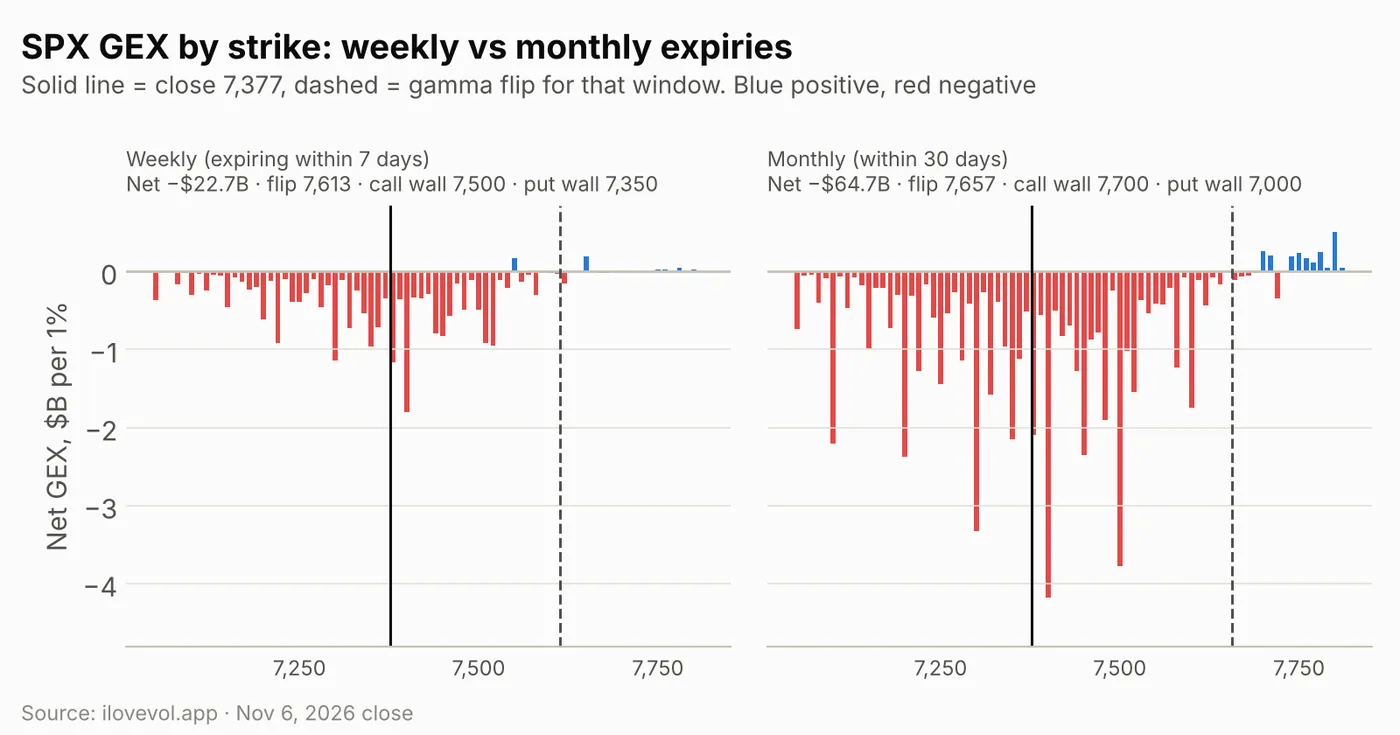
SPX weekly: the next 7 days hold −$22.7B, from −$25.7B, about 26% of the total. The window covers five expiries, Nov 9 to Nov 13, including CPI on Tuesday and PPI on Friday. Its flip is 7,613. The call wall dropped to 7,500 from 7,550, while the put wall stayed at 7,350, 27 points below the close. The largest weekly buckets are 7,400 (−$1.8B), 7,380 (−$1.2B) and 7,300 (−$1.1B), all within 80 points of spot.
SPX monthly: the 30-day window is −$64.7B (−$69.9B on Thursday), with the flip at 7,657, the call wall at 7,700 and the put wall at 7,000. Its largest buckets are 7,400 (−$4.2B), 7,500 (−$3.8B) and 7,300 (−$3.3B). That leaves about −$42B in expiries 8–30 days out, the heaviest part of the book and the part that covers Nvidia's results and the Nov 20 monthly, and about −$21B beyond 30 days.
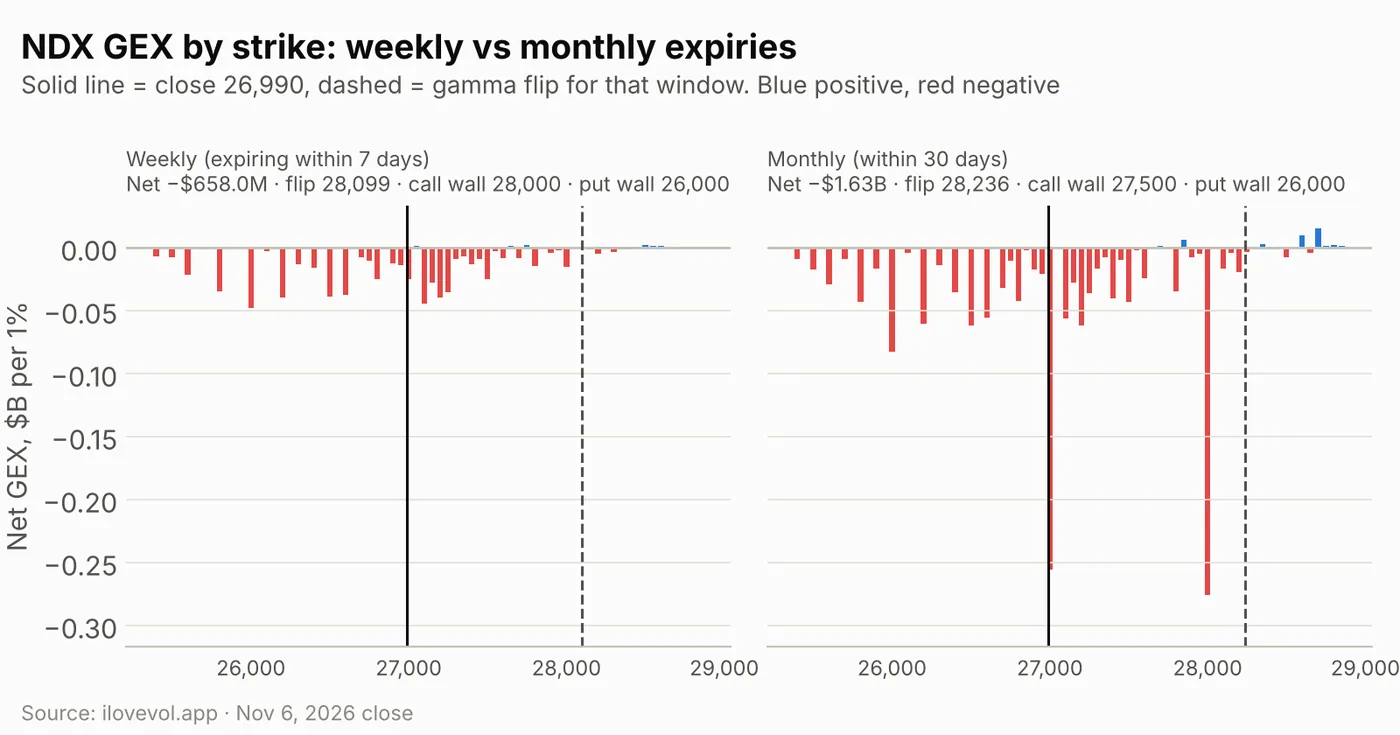
NDX outperformed, up 1.35% to 26,990, and its short gamma shrank to −$2.55B from −$3.29B. It is still 1,282 points under its 28,272 flip. Weekly is −$0.66B (flip 28,099, call wall 28,000, put wall 26,000) and monthly −$1.63B (flip 28,236, call wall 27,500, put wall 26,000). The monthly book's two largest buckets are 28,000 (−$0.28B) and 27,000 (−$0.26B); the second is just 10 points above the close. The 26,000 put wall is common to all three windows, about 990 points below.
RUT rose 0.89% to 2,754 and its gamma improved to −$2.03B from −$2.81B. It closed 93 points under its 2,847 flip, with the call wall at 2,850 and the put wall at 2,700.
3. The VIX complex: the front deflates, the inversion stays
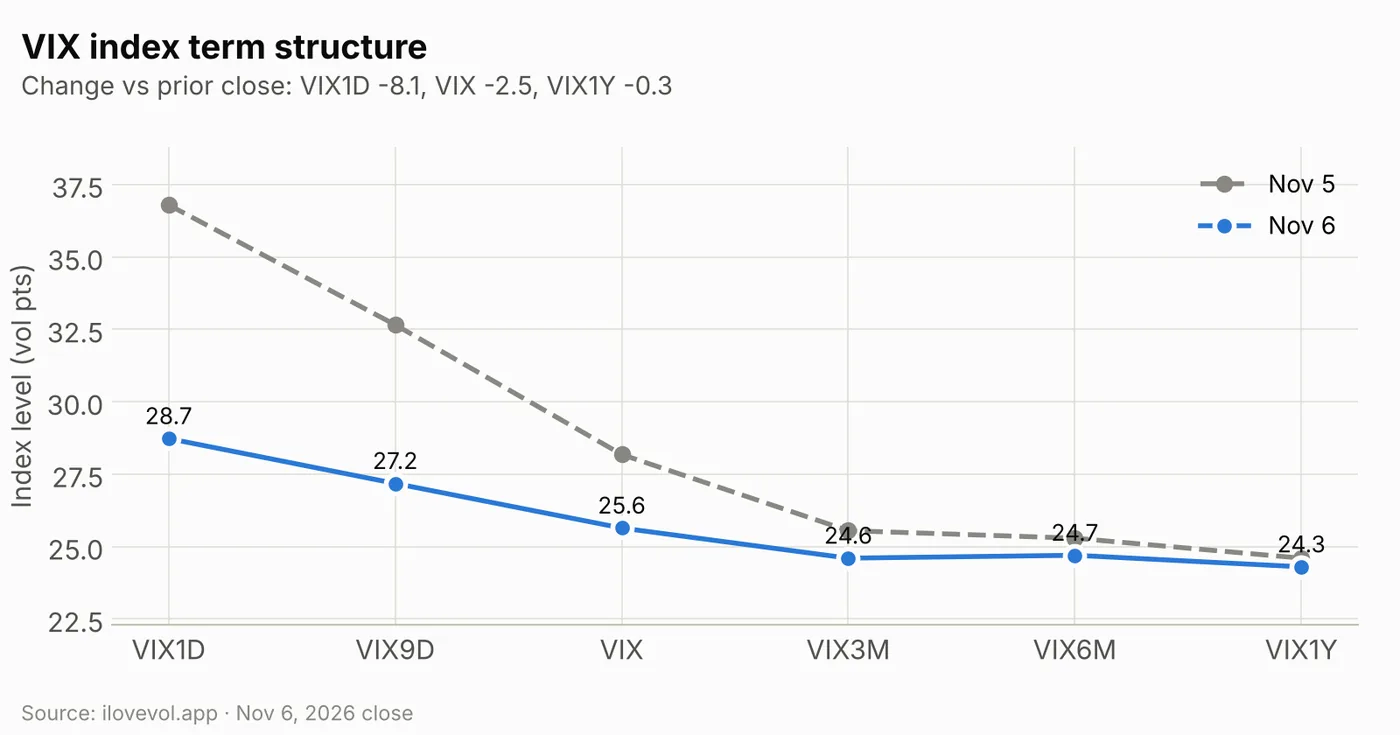
The decline was steepest at the front. VIX1D fell 8.07 to 28.73, VIX9D 5.48 to 27.18 and VIX 2.54 to 25.64, while VIX3M lost 0.95 to 24.60 and VIX1Y only 0.30 to 24.30. The curve is flatter but still slopes down through three months, with VIX6M (24.70) and VIX1Y roughly level with VIX3M.
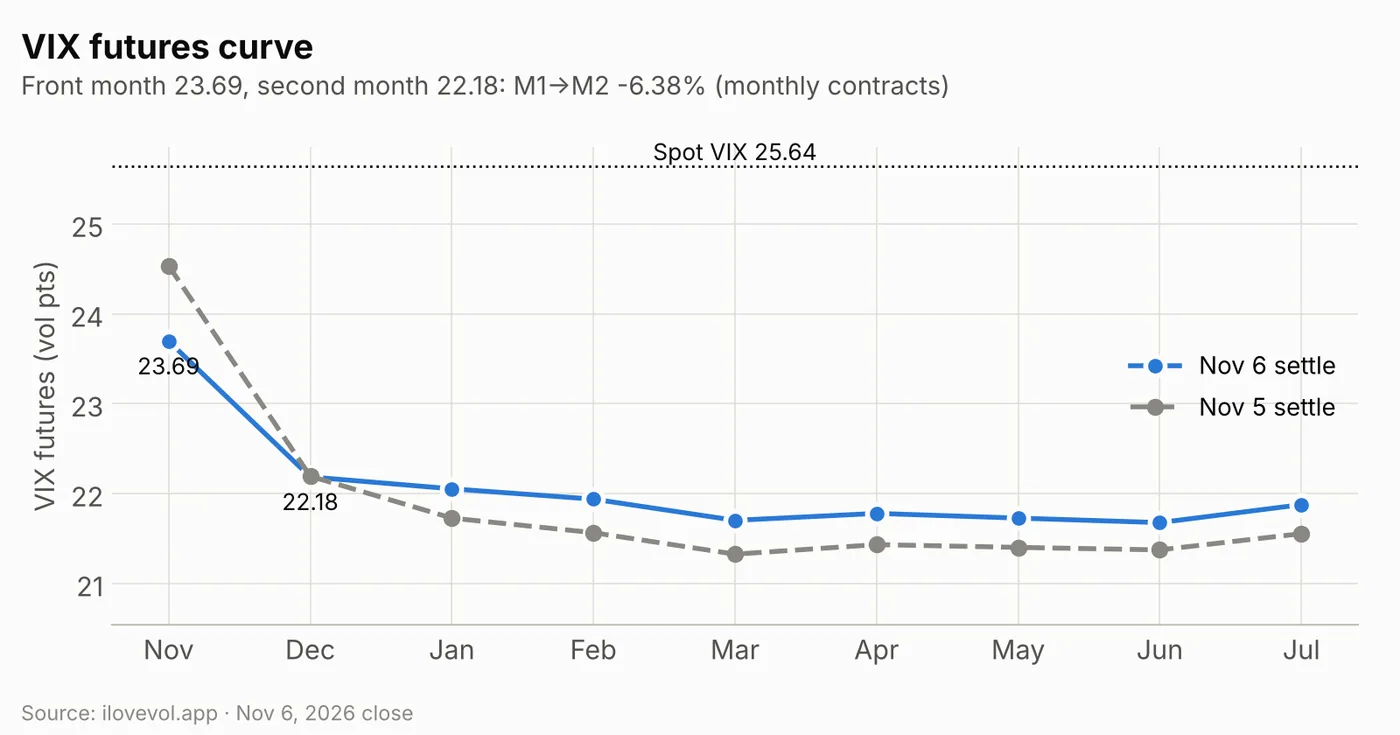
November futures settled at 23.69, down 0.84, while December was unchanged at 22.18. M1→M2 narrowed to −6.38% from −9.55%, still inverted. January through July rose 0.3–0.4 each and sit near 21.7–22.1, so the back of the curve priced slightly more vol even as the front eased. Spot VIX is 1.95 points above the November contract, down from 3.64. VVIX fell 13.1 to 121.9, still elevated.
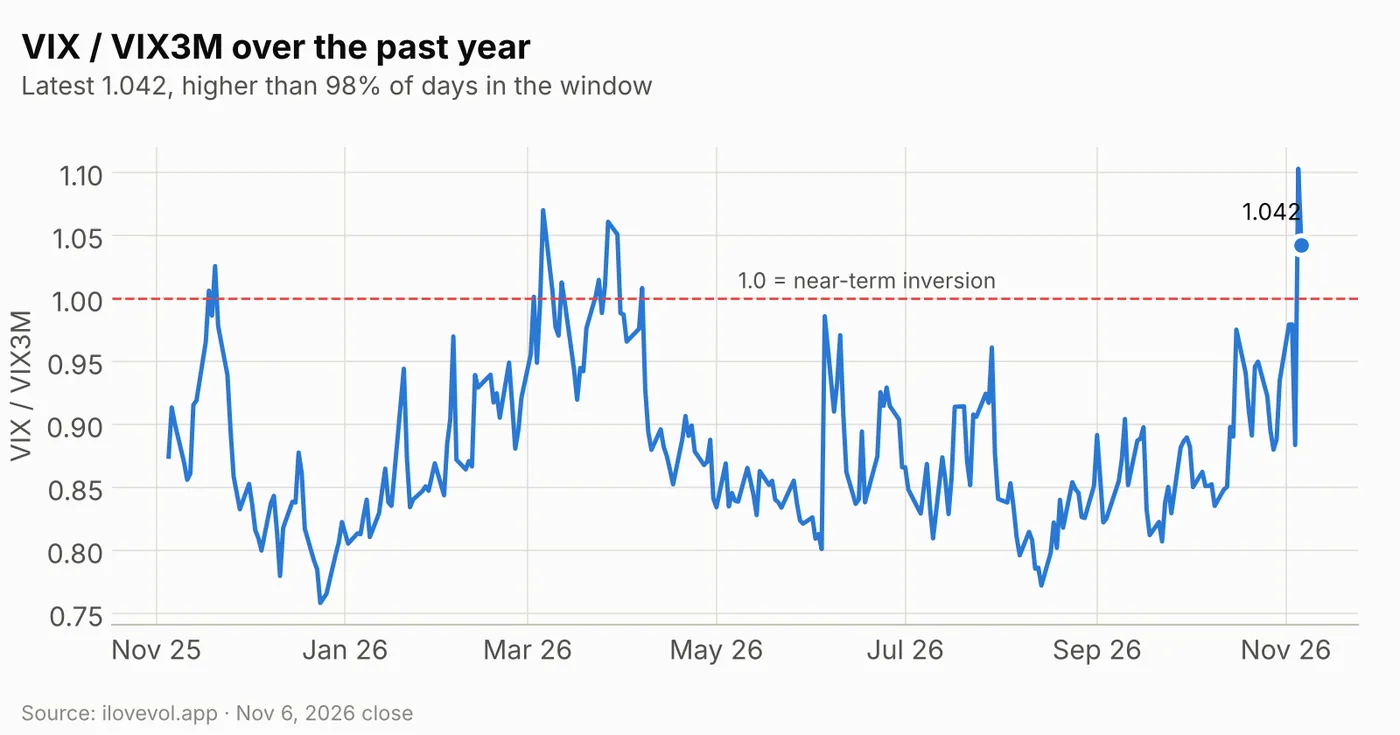
VIX/VIX3M eased to 1.042 from 1.103. It is the second straight close above the 1.0 inversion line and is higher than 98% of the past year's sessions; only Thursday's reading was higher.
4. Implied vs realized: the gap narrows
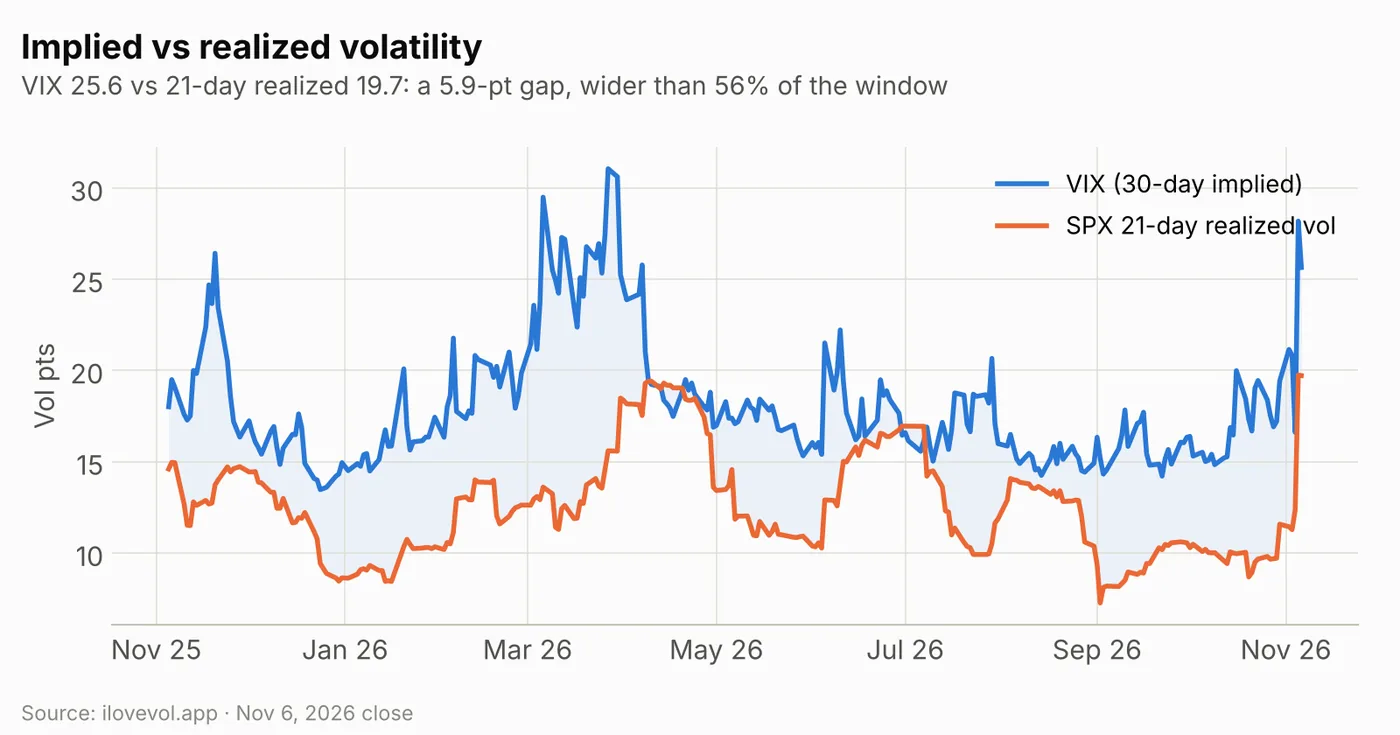
SPX 21-day realized vol held at 19.7 as Thursday's drop stays in the window. With VIX at 25.6, the gap narrowed to 5.9 points from 8.4, now wider than only 56% of the past year, close to a typical premium. Thirty-day ATM implied vol (19.4%) is roughly level with realized; most of the remaining VIX premium sits in the downside wing.
5. SPX surface: skew eases a bit, CPI and PPI carry the premium
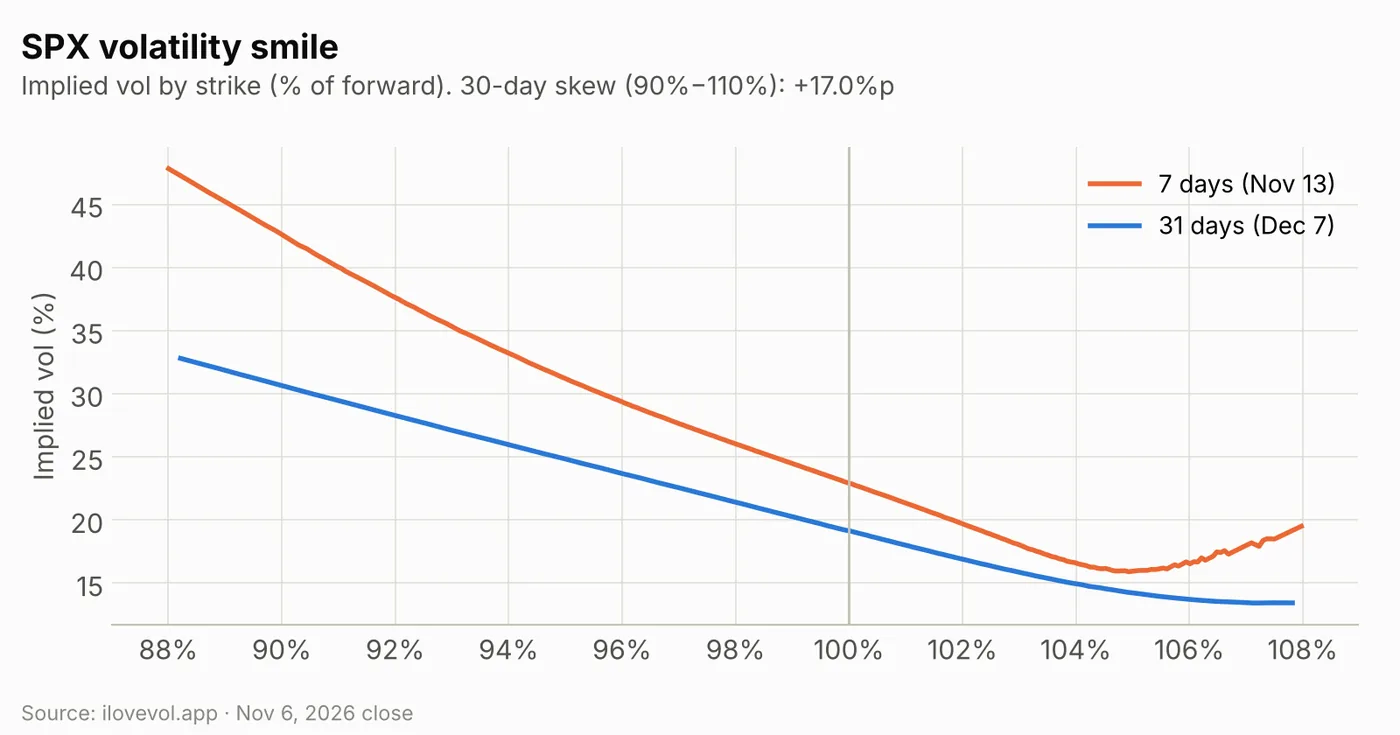
Thirty-day ATM IV fell to 19.4% from 21.5%, and 30-day skew (90% vs 110%) eased to 17.0 points from 18.3. The 90-day minus 30-day slope is −1.2 points, less inverted than Thursday's −2.6. The 7-day smile (Nov 13) runs from about 48% at 88% of the forward to about 23% at the money, bottoms near 16% around 105% and curls up; the 31-day curve (Dec 7) runs from about 33% to about 13.5%.
The expiry table shows where the premium sits. Monday's expiry is 17.5% ATM, about 81 points for one session. Tuesday's CPI expiry is 20.9%, about 137 points through Nov 10, and ATM IV keeps rising to 23.0% for Friday Nov 13 (PPI, after Cisco and Applied Materials), about 239 points through that day and the highest on the curve. It eases to 21.2% for Nov 17 and 21.6% for Nov 18 (the first expiry after Nvidia), and the Nov 20 monthly is 21.3%, about 313 points through expiry. CPI will be published without year-over-year changes for headline and core, so the monthly prints carry the weight.
6. Cross-asset Vol Sentiment: the stress spreads to credit and rates
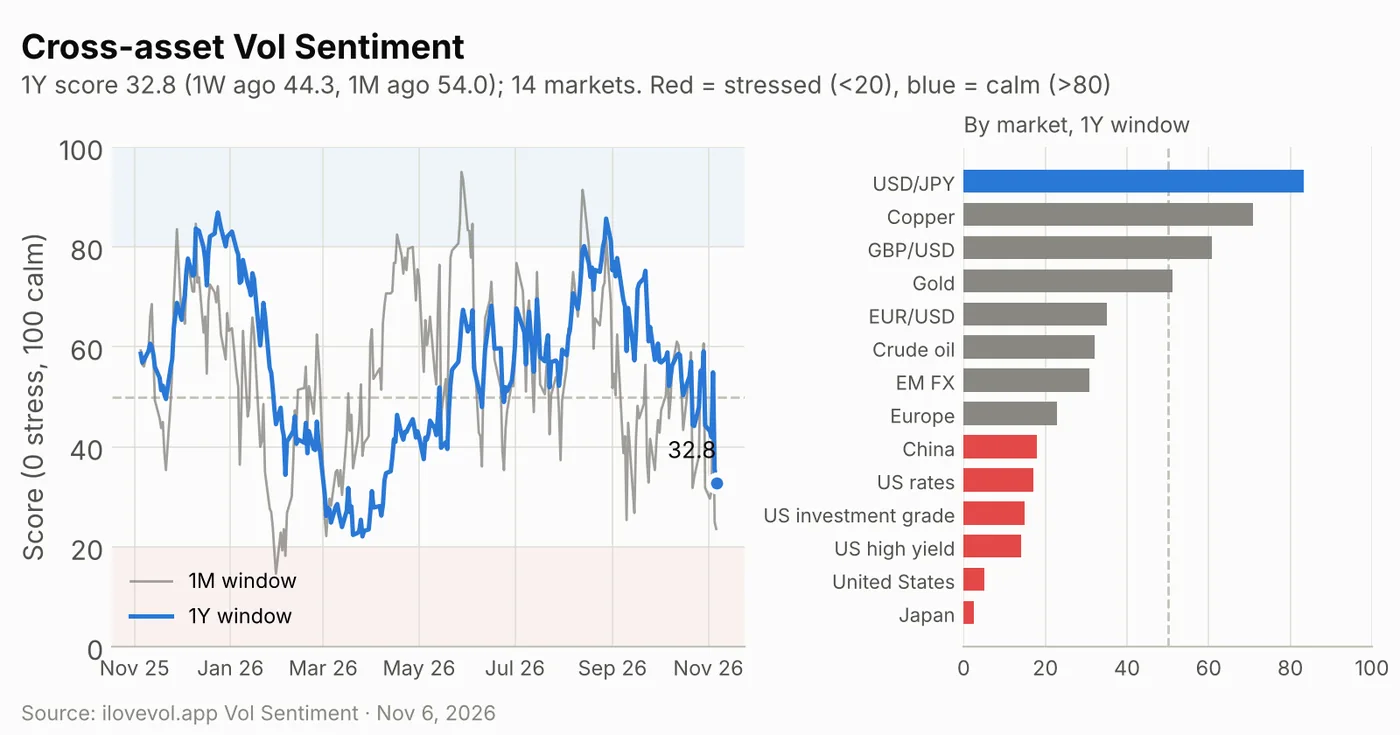
The cross-asset Vol Sentiment score places volatility in 14 equity, currency, rates, credit and commodity markets within its own one-year range (0 = stress, 100 = calm). On the one-year window it fell to 32.8 from 35.6 on Thursday (a revised reading), well under the 50 midpoint, 44.3 a week ago and 54.0 a month ago, and higher than only 11% of the past year's sessions. The shorter windows are lower still: 23.6 on one month (25.0 Thursday) and 18.3 on three months (18.6).
Six markets are now in the stressed zone below 20: Japan (2.5), US equities (5.0), US high yield (14.2), investment grade (15.0), US rates (17.1) and China (17.9), with Europe close behind at 22.9. USD/JPY (83.3) is the only calm market, ahead of copper (70.8) and GBP/USD (60.8). SPX index vol eased on Friday, but the broader backdrop kept deteriorating: the stress is no longer only in US equities, with credit, rates and Asian equity vol all near the top of their one-year ranges. It is context, not a trading signal.
Calendar: the week ahead
Economic data & Fed
| Date | Time (ET) | Event | Note |
|---|---|---|---|
| Mon Nov 9 | 8:40 | Fed Vice Chair for Supervision Bowman speaks | Goolsbee Q&A at 10:00 |
| Mon Nov 9 | 13:00 | 3-year note auction ($58B) | Refunding week |
| Tue Nov 10 | 6:00 (expected) | NFIB small business optimism (Oct) | |
| Tue Nov 10 | 8:30 | October CPI; real earnings | No y/y for headline or core; Nov 10 expiry 20.9% ATM vs 17.5% Mon |
| Tue Nov 10 | 13:00 | 10-year note auction ($42B) | Waller and Bowman speak on the outlook |
| Wed Nov 11 | – | Veterans Day: stocks open, bond market closed | |
| Thu Nov 12 | 8:30 | Jobless claims | |
| Thu Nov 12 | 13:00 | 30-year bond auction ($25B) | |
| Fri Nov 13 | 8:30 | PPI (Oct) | Nov 13 expiry 23.0% ATM, highest on the curve |
| Tue Nov 17 | 8:30 | Retail sales (Oct); import prices | |
| Wed Nov 18 | 14:00 | FOMC minutes (Oct 27–28 meeting) | Next FOMC decision Dec 9 |
Earnings
| Date | Timing | Companies | Note |
|---|---|---|---|
| Mon Nov 9 | Before open | KKR, Constellation Energy, Barrick, NRG | Power names tied to the data-center debate |
| Mon Nov 9 | After close | Take-Two, Occidental, Rocket Lab, The Trade Desk | |
| Tue Nov 10 | After close | CoreWeave | First AI-infrastructure print after the chip rout; Nov 11 expiry 22.1% ATM |
| Thu Nov 12 | Before open | Nebius, Brookfield | |
| Thu Nov 12 | After close | Cisco, Applied Materials, Cerebras | Reaction in the Nov 13 expiry (23.0% ATM) |
| Fri Nov 13 | Before open | Alibaba (expected) | |
| Tue Nov 17 | After close | Nvidia (Home Depot, Disney before open) | Nov 18 expiry 21.6% ATM |
Volatility dates (expirations, events)
| Date | Event | Note |
|---|---|---|
| Mon Nov 9 | First SPX expiry after payrolls | 17.5% ATM, about 81 pts for the day |
| Tue Nov 10 | SPX expiry on CPI day | 20.9% ATM, about 137 pts priced through Nov 10 |
| Fri Nov 13 | Weekly SPX expiry with PPI | 23.0% ATM, about 239 pts through Nov 13 |
| Wed Nov 18 | VIX November futures and options expiration | Nov future 23.69, 1.95 under spot VIX (25.64) |
| Fri Nov 20 | SPX November monthly expiration | 21.3% ATM; without everything through it, modeled gamma at spot is about −$34B |
| Thu Nov 26 / Fri Nov 27 | Thanksgiving (closed) / 1:00 pm early close |
What I'm watching
- 7,350 to 7,400. The weekly put wall (7,350) is 27 points below the close and the largest negative bucket (7,400, −$6.4B) is 23 points above. Inside that band dealer hedging can amplify small moves in both directions.
- 7,300, then 7,000. Below the put wall, 7,300 (−$6.2B) is the next large negative strike, and the modeled profile stays near −$100B or lower all the way down to the 7,000 monthly and all-expiry put wall.
- 7,500 and the 7,570–7,657 band. The weekly call wall moved down to 7,500, also a −$5.6B bucket. Above it sit the ex-monthly flip (7,570), the weekly flip (7,613), the all-expiry flip (7,617) and the monthly flip (7,657). The short-gamma regime holds until SPX gets back into that band.
- The CPI premium. ATM IV steps from 17.5% for Monday to 20.9% for Tuesday and 23.0% for Friday. A CPI move inside about 137 points through Tuesday would start to bleed the front end; VIX1D at 28.7 shows Monday is still priced well above Friday's realized move.
- Inversion. VIX/VIX3M 1.042 after 1.103, M1→M2 −6.38% and VVIX 121.9. A close back under 1.0 would mark Thursday as a one-off shock; a third inverted close would point to a longer repricing.
Sources
- AP via Yahoo Finance: How major US stock indexes fared Friday 11/6/2026
- Yahoo Finance: Stock market today: Nasdaq and S&P 500 rebound, Dow slips to cap bruising week for AI stocks
- StockTitan: Chip Stocks Bounce Back in the Stock Market Today Live, November 6, 2026, a Day After Their Selloff
- TheStreet: Stock Market Today (Nov. 6, 2026): Nasdaq, S&P 500 rise after midterms AI rout
- BLS: Schedule of Releases for November 2026
- Federal Reserve: November 2026 calendar
- US Treasury: Quarterly Refunding Statement (Nov 4, 2026)
- StockTitan: Cisco, GTA Maker Take-Two and CBS Owner Skydance Lead the Earnings Week of November 9
- CoreWeave IR: Date of Third Quarter 2026 Financial Results
- NVIDIA IR: Conference Call for Third-Quarter Financial Results
- Macroption: VIX Expiration Calendar 2026
Volatility data: ilovevol.app. GEX assumes dealers are long calls and short puts. VIX futures use settlement prices. Implied moves are approximations from expiry ATM IV over the trading sessions to expiry. Vol Sentiment: ilovevol.app cross-asset score (0 = stress, 100 = calm), one-year window unless noted; day-over-day changes use the latest (revised) prior row.
This review is for informational and educational purposes only and is not investment advice. See the disclaimer.
The Daily Vol sends this review to your inbox each trading day: dealer gamma levels, the VIX curves, the SPX vol surface and the levels to watch. Free, one click to unsubscribe.