Home › Blog › Daily Market Review
Daily Market Review · US close
AI chip rout sinks SPX 4.4% as dealer gamma plunges to −$95.2B and VIX jumps to 28.2
SPX fell 4.36% to 7,354, erasing the post-midterm rally and closing 280 points under its 7,634 flip as net GEX swung from +$32.7B to −$95.2B. VIX rose 11.57 to 28.18, the whole VIX curve inverted and VIX/VIX3M hit 1.103, its highest in a year. Friday's jobs-day expiry now prices about 167 points.
- Chip and AI stocks collapsed for a second day on worries that the new Democratic Congress will slow the data-center build-out. SPX −4.36% to 7,354, NDX −6.36%, the Dow −3.44% and the semiconductor index −12.3%. Nvidia lost 9.3%, AMD and Micron about 17%.
- Net GEX swung from +$32.7B to −$95.2B, and SPX closed 280 points under its 7,634 flip. Every bucket below 7,700 is negative; the largest sit at 7,300, 7,400 and 7,500 (about −$6.2B to −$6.6B each). The weekly put wall is 7,350, right at the close.
- VIX jumped 11.57 to 28.18 and VIX1D to 36.80. The whole index curve is inverted, VIX/VIX3M is 1.103 (a one-year high) and the November future (24.54) sits 3.64 under spot. Thursday's expiry priced about 64 points; SPX moved 335.
Scoreboard
| Close | Chg | Prev | |
|---|---|---|---|
| SPX | 7,354 | −4.36% | 7,689 |
| NDX | 26,630 | −6.36% | 28,437 |
| VIX | 28.18 | +11.57 | 16.61 |
| VIX1D | 36.80 | +24.72 | 12.08 |
| VVIX | 135.0 | +44.6 | 90.4 |
| VX Nov / Dec | 24.54 / 22.19 | −9.55% M1→M2 | +1.35% |
| VIX / VIX3M | 1.103 | +0.219 | 0.884 |
| 30D ATM IV / skew | 21.5% / 18.3 | +8.5 / +7.8 | 13.0% / 10.5 |
| Window | Net GEX | Chg | Prev | Flip | Call wall | Put wall | |
|---|---|---|---|---|---|---|---|
| SPX | All | −$95.2B | −$127.9B | +$32.7B | 7,634 | 8,000 | 7,000 |
| SPX | Weekly | −$25.7B | −$33.7B | +$8.0B | 7,651 | 7,550 | 7,350 |
| SPX | Monthly | −$69.9B | −$77.7B | +$7.8B | 7,677 | 7,700 | 7,000 |
| NDX | All | −$3.29B | −$2.22B | −$1.07B | 28,445 | 29,000 | 26,000 |
| NDX | Weekly | −$0.95B | −$0.58B | −$0.37B | 28,314 | 28,300 | 26,000 |
| NDX | Monthly | −$2.18B | −$1.30B | −$0.88B | 28,438 | 29,500 | 26,000 |
Dealer gamma by expiry window. All = every listed expiry; Weekly = contracts expiring within 7 calendar days; Monthly = within 30 days. Net GEX in $ per 1% move.
1. The tape: the AI trade breaks and the post-midterm rally is gone
One day after the biggest post-midterm rally in decades, stocks gave it all back and more. The S&P 500 fell 4.36% to 7,354, the Dow lost 1,833 points (3.44%) to 51,523, the Nasdaq Composite dropped 5.52% to 24,315 and closed in correction territory, more than 10% under its Oct. 6 record, and the Nasdaq-100 fell 6.36% to 26,630. The Russell 2000 lost 4.45% to 2,730. The PHLX semiconductor index fell 12.3%.
The selling started in chips and AI infrastructure. Wraps from Yahoo Finance, StockTitan and Fox Business tie it to worries that the Democratic sweep of Congress will bring tighter rules on data centers and slow their build-out, as power prices became a campaign issue; UBS strategists estimated that about 30% of the data-center capacity expected in 2028 is now at risk. Micron fell 17.5%, AMD 17.3%, Marvell 16.4%, Arm 13.1% after its results, Broadcom 10.4%, Intel 10.3%, Qualcomm 9.5% after weak phone-chip sales, and Nvidia 9.3%, wiping out its gain for the year. Tesla dropped about 10.8% and Meta about 4%. AppLovin was a rare winner, up 31% on strong results. Nomura's Charlie McElligott described hedge funds locking in 2026 gains, and Vanda Research reported the heaviest retail net selling since March 2020.
Data were not the story: jobless claims fell to 189,000 and third-quarter productivity rose 3.6%. The 10-year yield slipped about 6 basis points to 4.84%, gold edged up to about $4,100, WTI rose about 3% to near $91 and bitcoin fell about 5% to under $76,000. The Bank of England raised its rate to 4%. Overseas, Korea's Kospi fell 5.3% earlier in the day. Airbnb, Lyft, IonQ and Akamai reported after the close.
Why it matters for vol: this was a move far larger than options priced. Thursday's expiry implied about 64 points and SPX moved 335. It came the day before the October jobs report, with dealers now short gamma across every expiry window. Short-gamma hedging tends to add to moves rather than absorb them, which is why the front of the vol curve is now priced above everything behind it.
2. Dealer gamma: from long to deeply short in one session
Net GEX across all expiries swung from +$32.7B to −$95.2B per 1% move, a change of about −$128B. The flip moved down to 7,634 (7,659 on Wednesday), but SPX fell much faster and closed 280 points under it, after closing 30 points above it the day before.
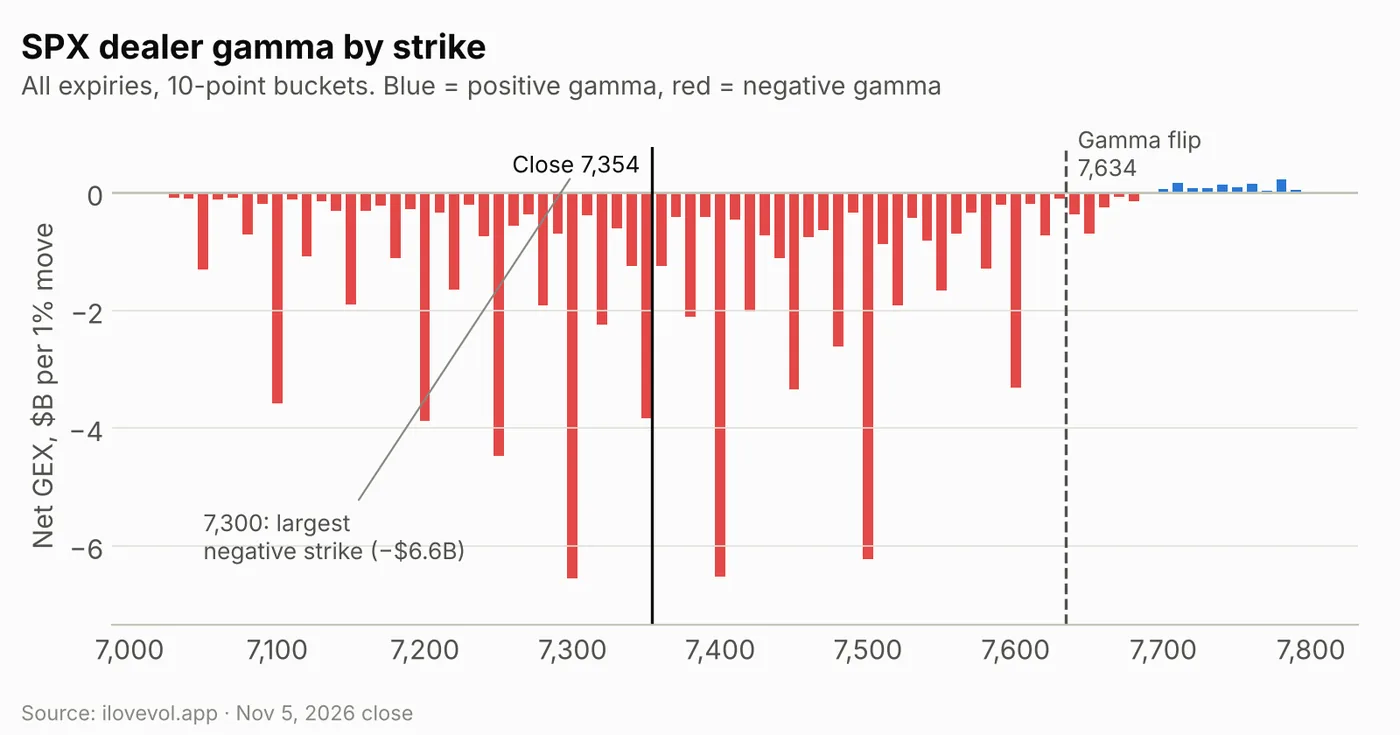
Every 10-point bucket from 7,030 up to 7,690 is negative. The three largest are 7,300 (−$6.6B), 7,400 (−$6.5B) and 7,500 (−$6.2B), followed by 7,250 (−$4.5B), 7,000 (−$4.1B) and 7,200 (−$3.9B). The close at 7,354 sits between the two largest. The first positive bucket is 7,700, and nothing above it is larger than about +$0.2B: the call-side cushion that existed on Wednesday has been repriced away.
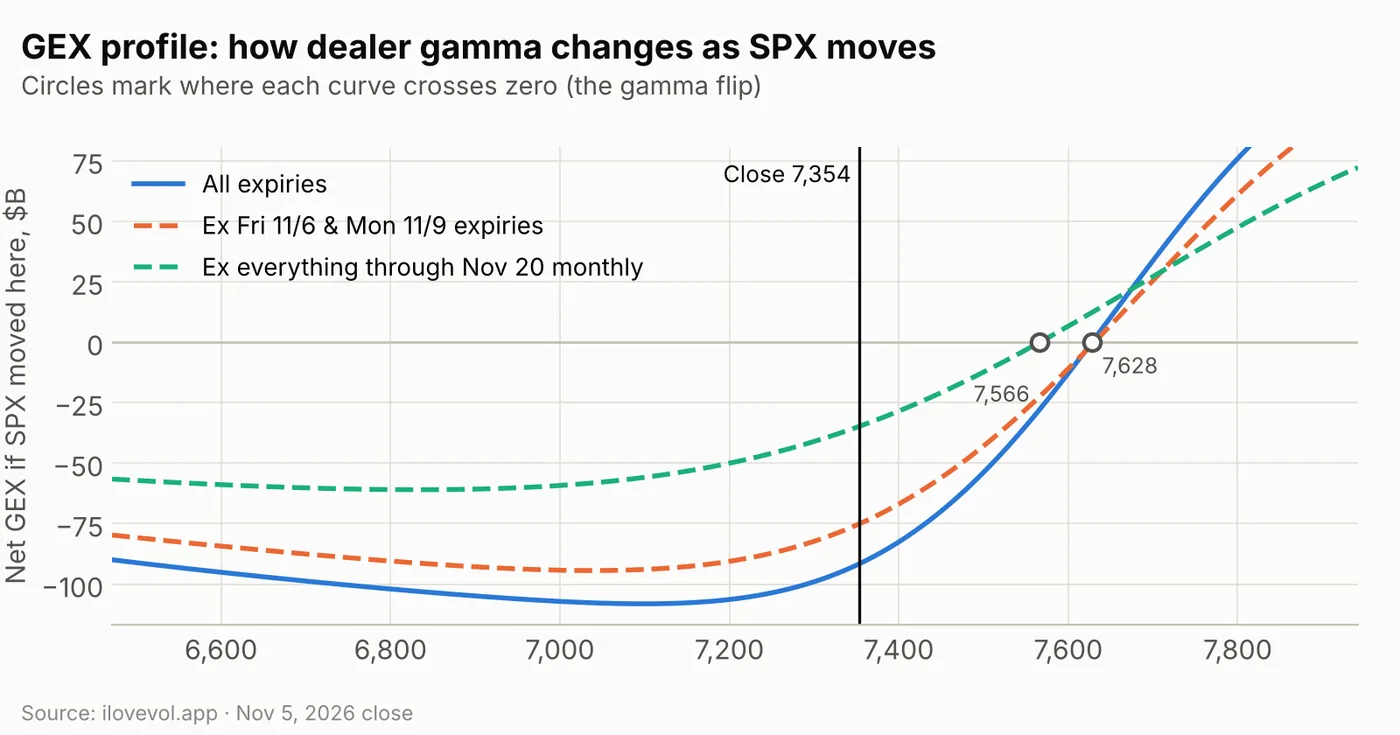
The modeled profile crosses zero near 7,628, close to the site's 7,634 flip, and reads about −$92B at the close. It keeps falling below spot, to a low of about −$108B near 7,100, and only turns up sharply above 7,600.
The next two expiries are not the whole story. Without Nov 6 and Nov 9, modeled gamma at spot is still about −$75B, with a flip near 7,631.
The longer-dated book turned short too. Without everything through the Nov 20 monthly, gamma at spot is about −$35B with a flip near 7,566, 212 points above the close. On Wednesday the same curve was about +$21B at spot.
Weekly vs monthly: short gamma in every window
All three SPX windows went from positive to negative (numbers in the dealer-gamma table under the scoreboard). Their flips sit between 7,634 and 7,677, so the close is now 280–323 points below every flip, a reversal of Wednesday, when it was perched at the top of that band.
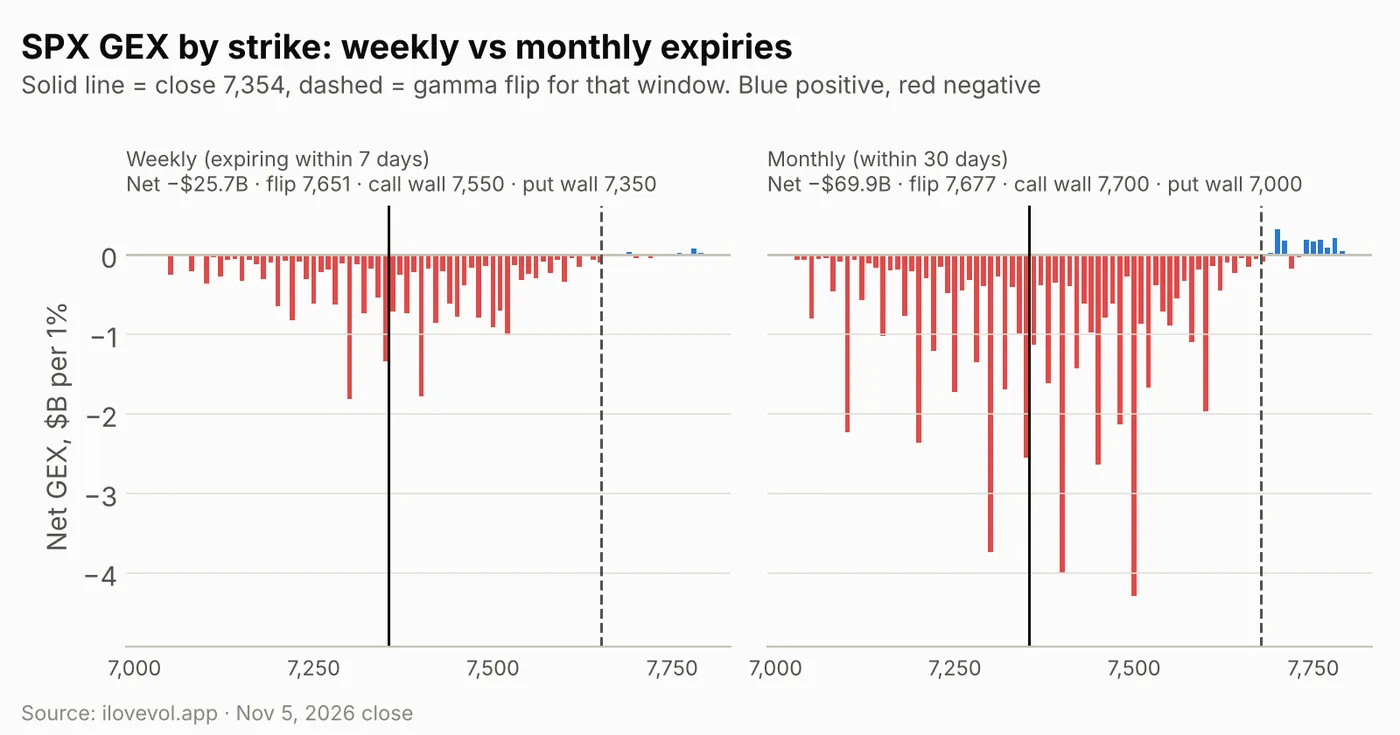
SPX weekly: the next 7 days hold −$25.7B, from +$8.0B, about 27% of the total. The window covers five expiries, Nov 6 to Nov 12, including the jobs report and CPI. Its flip is 7,651. The call wall dropped to 7,550 (7,700 on Wednesday) and the put wall to 7,350 (7,650), right at the close. The largest weekly buckets are 7,300 (−$1.8B), 7,400 (−$1.8B) and 7,350 (−$1.3B).
SPX monthly: the 30-day window is −$69.9B (+$7.8B on Wednesday), with the flip at 7,677, the call wall at 7,700 and the put wall down at 7,000. Its largest buckets are 7,500 (−$4.3B), 7,400 (−$4.0B) and 7,300 (−$3.7B). That leaves about −$44B in expiries 8–30 days out, the heaviest part of the book, and about −$25.3B beyond 30 days (+$24.9B on Wednesday).
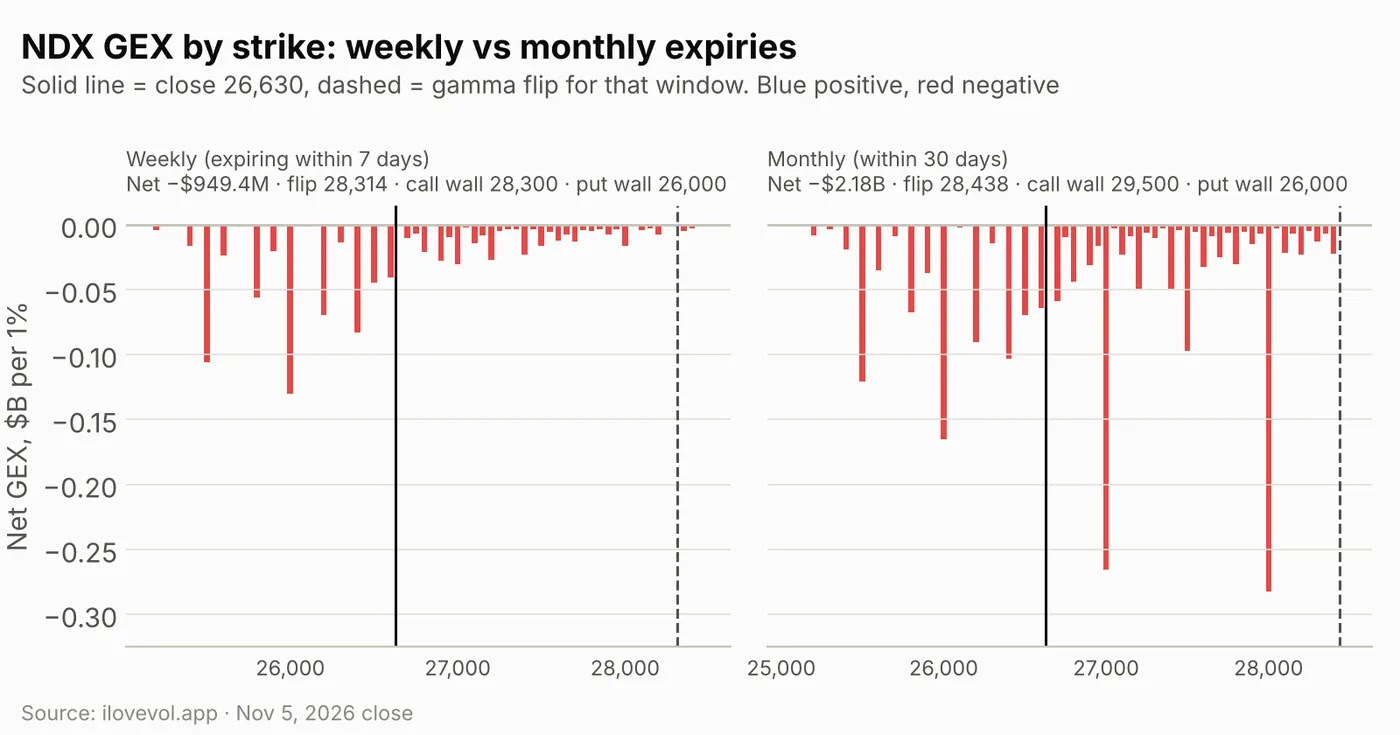
NDX took the worst of it, down 6.36% to 26,630, and its gamma tripled on the short side to −$3.29B from −$1.07B. It closed 1,815 points under its 28,445 flip. Weekly is −$0.95B (flip 28,314, call wall 28,300, put wall 26,000) and monthly −$2.18B (flip 28,438, call wall 29,500, put wall 26,000). The monthly book's largest buckets are 28,000 (−$0.28B) and 27,000 (−$0.27B); both are now above spot. The 26,000 put wall is common to all three windows, 630 points under the close.
RUT fell 4.45% to 2,730 and its gamma flipped to −$2.81B (+$1.11B on Wednesday). It closed 108 points under its 2,838 flip, with the call wall at 2,850 and the put wall at 2,680, 50 points below.
3. The VIX complex: full inversion
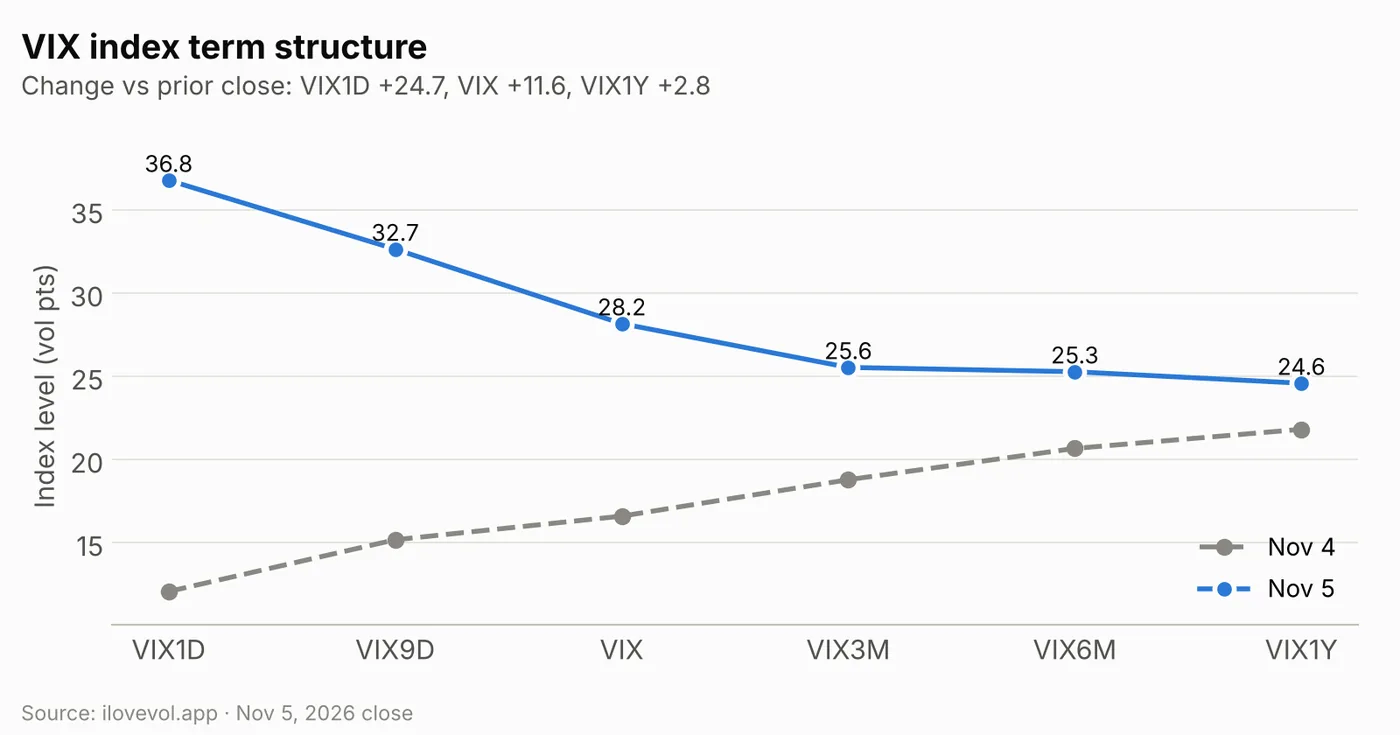
The index curve flipped from a clean upward slope to a clean downward one. VIX1D tripled, up 24.72 to 36.80, VIX9D rose 17.47 to 32.66 and VIX 11.57 to 28.18. The gains shrink with maturity: VIX3M rose 6.75 to 25.55, VIX6M 4.61 to 25.29 and VIX1Y 2.77 to 24.60. Every point now sits above the one behind it.
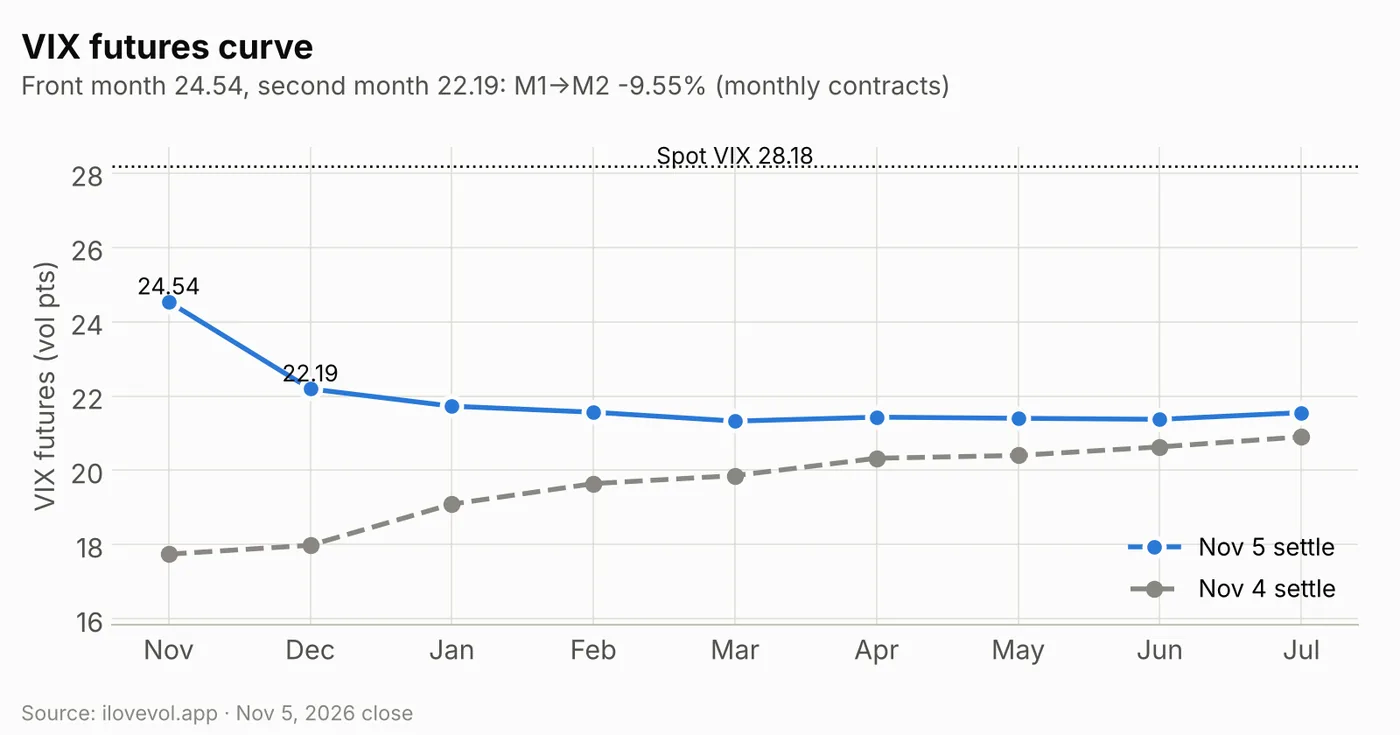
Futures rose less than spot. November settled at 24.54 (+6.79) and December at 22.19 (+4.21), so M1→M2 inverted to −9.55% (+1.35% on Wednesday). January rose 2.64 to 21.73 and July only 0.65 to 21.55, so the curve beyond December is nearly flat around 21.3–21.7. Spot VIX is 3.64 points above the November contract, which settles on Nov 18, after sitting 1.13 below it on Wednesday: futures price some decline from today's spot by mid-November. VVIX jumped 44.6 to 135.0.
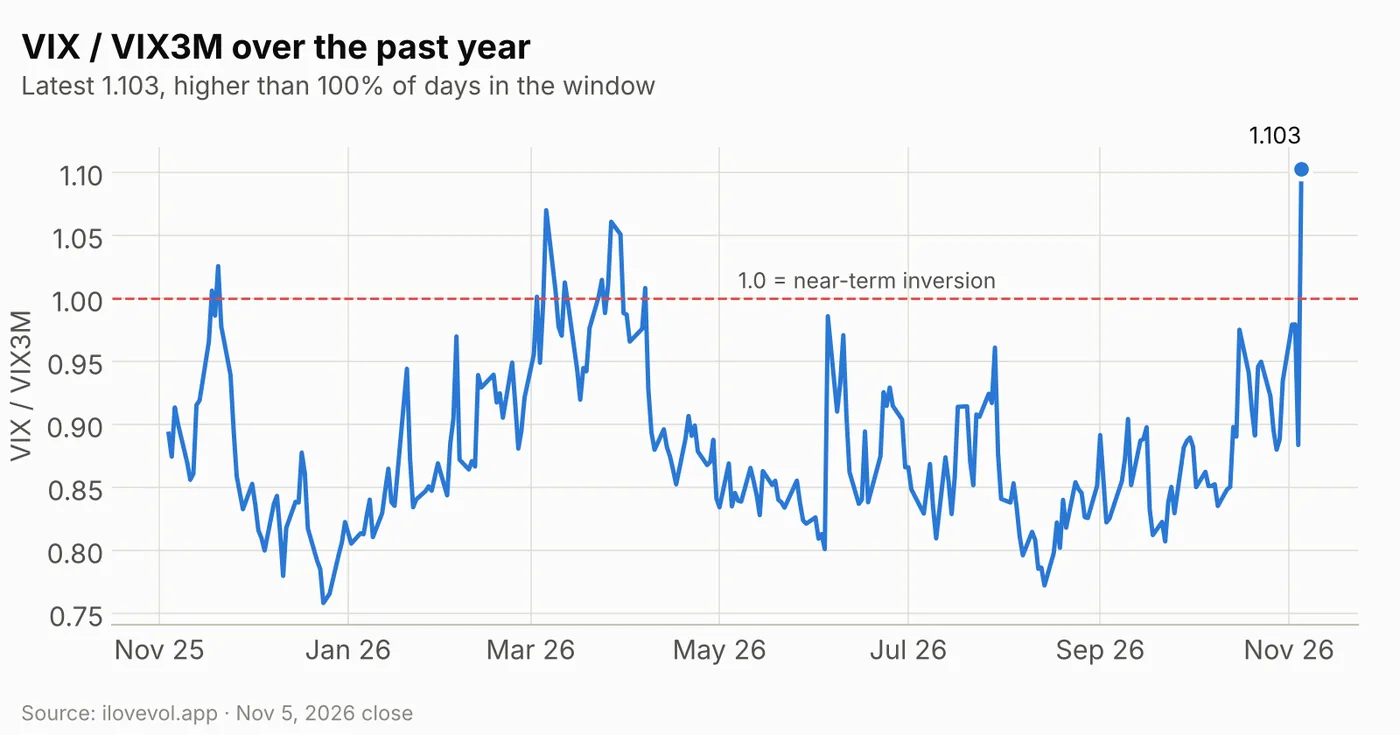
VIX/VIX3M jumped to 1.103 from 0.884, the highest reading of the past year, above the late-March peak of 1.061. It is the first close above the 1.0 inversion line since April 7, and VIX itself closed at its highest level since March 30.
4. Implied vs realized: realized catches up, implied runs ahead
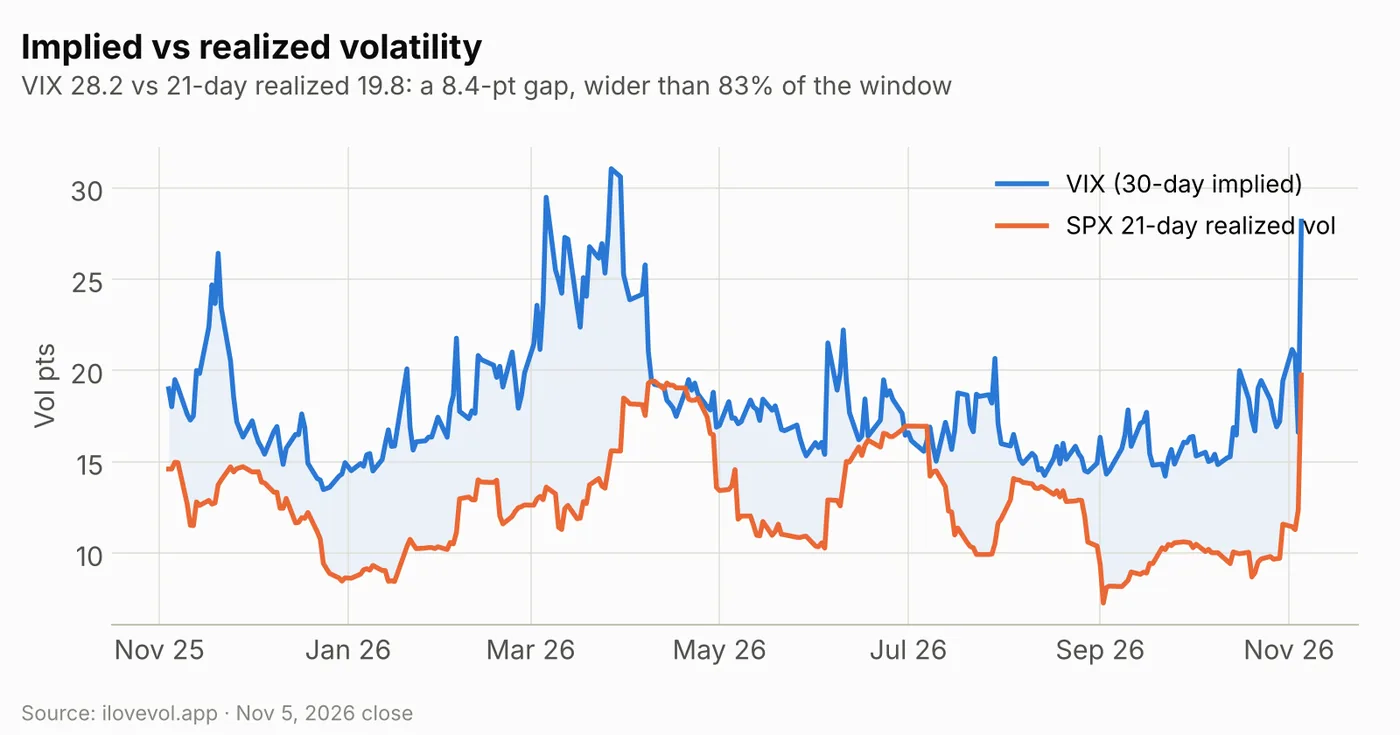
SPX 21-day realized vol jumped to 19.8 from 12.4 as the 4.36% drop entered the window. Implied rose even faster: with VIX at 28.2, the gap widened to 8.4 points from 4.2, wider than 83% of the past year. Thirty-day ATM implied vol, at 21.5%, is less than 2 points over realized; most of the VIX premium sits in the downside wing, not at the money.
5. SPX surface: the front end reprices
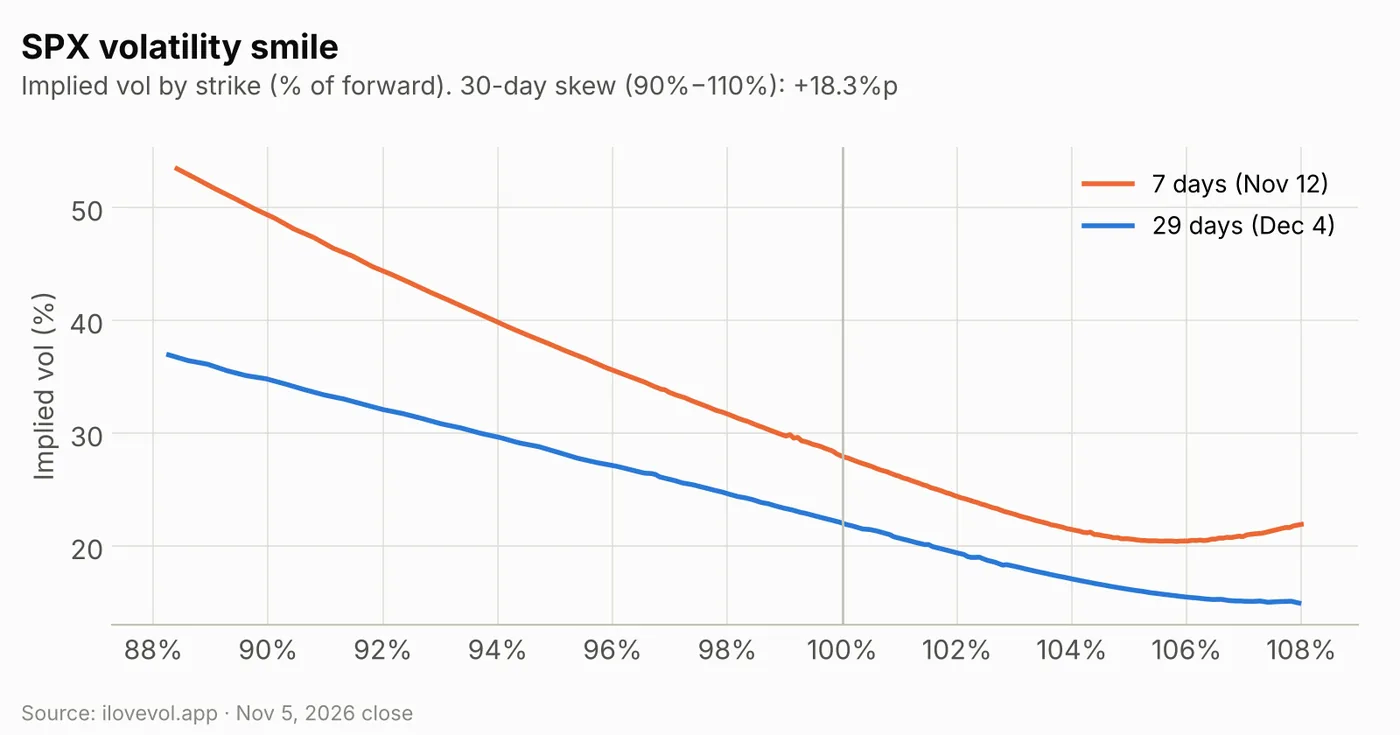
Thirty-day ATM IV rose to 21.5% from 13.0%, and 30-day skew (90% vs 110%) widened to 18.3 points from 10.5. The 90-day minus 30-day slope turned negative at −2.6 points, from +0.9. The 7-day smile (Nov 12) runs from about 53% at 88% of the forward to about 28% at the money and a low near 20–21% around 105–106%; the 29-day curve (Dec 4) runs from about 37% at 88% to about 15% at 108%.
Thursday's expiry priced about 64 points and SPX moved 335. Friday's jobs-day expiry is now 36.0% ATM, about 167 points for one session, the highest on the surface. After that, ATM IV is 25.6% for Nov 9, 26.8% for Nov 10 (CPI; about 278 points through that day) and 27.3% for Nov 13 (PPI). The Nov 20 monthly is 24.1%, about 432 points through expiry.
6. Cross-asset Vol Sentiment: US equities hit the floor
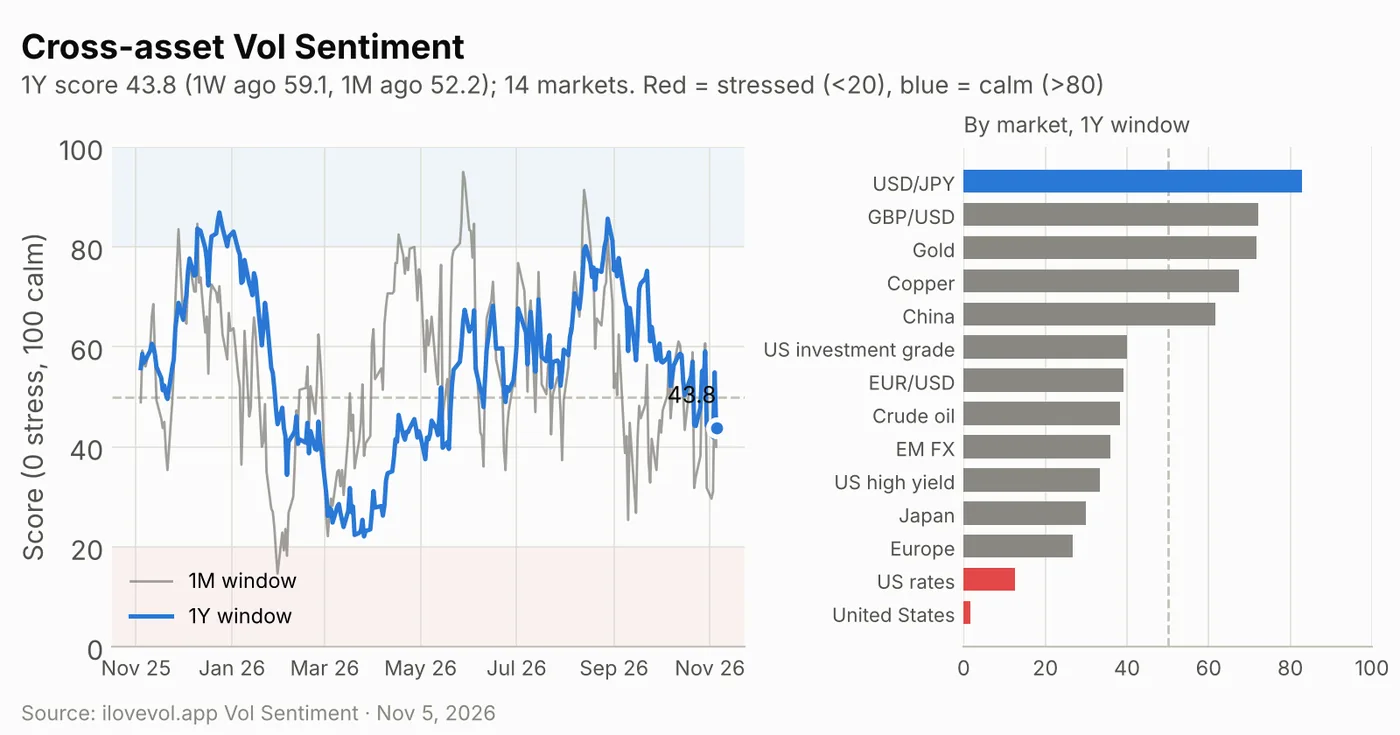
The cross-asset Vol Sentiment score places volatility in 14 equity, currency, rates, credit and commodity markets within its own one-year range (0 = stress, 100 = calm). On the one-year window it fell to 43.8 from 54.9 on Wednesday (a revised reading), below the 50 midpoint, 59.1 a week ago and 52.2 a month ago, and higher than only 27% of the past year's sessions. The shorter windows fell further: 40.0 on one month (from 53.9) and 26.1 on three months (from 36.6).
The move is concentrated in US equities, which dropped to 1.7, the bottom of its one-year range. US rates (12.5) is the only other market under 20. Europe (26.7) and Japan (30.0) sit in the lower third, while credit is in the middle: high yield 33.3, investment grade 40.0. USD/JPY (82.9) is the only market in the calm zone, with GBP/USD (72.1) and gold (71.7) close behind. Next to the SPX picture, this looks like an equity-led shock rather than a broad cross-asset stress event so far. It is context, not a trading signal.
Calendar: the week ahead
Economic data & Fed
| Date | Time (ET) | Event | Note |
|---|---|---|---|
| Fri Nov 6 | 8:30 | October jobs report | Nov 6 expiry 36.0% ATM, about 167 pts |
| Fri Nov 6 | 10:00 (expected) | University of Michigan sentiment (Nov, prelim) | |
| Fri Nov 6 | 12:15 | Fed Vice Chair for Supervision Bowman speaks | Logan, Williams and Musalem also speak (times –) |
| Tue Nov 10 | 8:30 | October CPI; real earnings | Nov 10 expiry 26.8% ATM vs 25.6% Nov 9 |
| Thu Nov 12 | 8:30 | Jobless claims | |
| Fri Nov 13 | 8:30 | PPI (Oct) | Nov 13 expiry 27.3% ATM |
| Tue Nov 17 | 8:30 (expected) | Retail sales (Oct); import prices | |
| Wed Nov 18 | 14:00 | FOMC minutes (Oct 27–28 meeting) |
Earnings
| Date | Timing | Companies | Note |
|---|---|---|---|
| Thu Nov 5 | After close | Airbnb, Lyft, IonQ, Akamai, IREN | Reaction in the Nov 6 expiry |
| Fri Nov 6 | Before open | Charter, Moderna, Humana, Vistra, Berkshire Hathaway (expected) | Same morning as the jobs report |
| Mon Nov 9 | Before open | Constellation Energy, KKR, NRG | Power names tied to the data-center debate |
| Mon Nov 9 | After close | CoreWeave (date expected), Take-Two, Occidental | First AI-infrastructure print after the selloff |
| Thu Nov 12 | After close | Applied Materials, Cisco, Cerebras | Chip-equipment read after a −12% SOX day |
| Fri Nov 13 | Before open | Alibaba (expected) |
Volatility dates (expirations, events)
| Date | Event | Note |
|---|---|---|
| Fri Nov 6 | Weekly SPX expiry with the jobs report | 36.0% ATM, about 167 pts for the day |
| Tue Nov 10 | SPX expiry on CPI day | 26.8% ATM, about 278 pts priced through Nov 10 |
| Wed Nov 11 | Veterans Day: stocks open, bond market closed | |
| Wed Nov 18 | VIX November futures and options expiration | Nov future 24.54, 3.64 under spot VIX (28.18) |
| Fri Nov 20 | SPX November monthly expiration | 24.1% ATM; without everything through it, modeled gamma at spot is about −$35B |
| Thu Nov 26 / Fri Nov 27 | Thanksgiving (closed) / 1:00 pm early close |
What I'm watching
- 7,350 and 7,300. The weekly put wall is at the close, and 7,300 (−$6.6B) is the largest negative bucket in the book, 54 points lower. Below that, the modeled profile stays deeply negative all the way down to 7,000, the monthly and all-expiry put wall.
- 7,400–7,500 overhead. The 7,400 (−$6.5B) and 7,500 (−$6.2B) buckets are the first big strikes above spot, and the weekly call wall is 7,550. With dealers short gamma there too, a rebound can be as fast as the drop.
- 7,634–7,677. All three flips are 280–323 points above the close. Nothing changes the short-gamma regime until SPX gets back into that band.
- Friday's 36.0%. The jobs-day expiry prices about 167 points. Thursday's expiry priced 64 and delivered 335; a payrolls move inside 167 would start to bleed the front end, a bigger one would test whether VIX1D's 36.8 was enough.
- Inversion. VIX 28.18 vs 24.54 for November, M1→M2 at −9.55%, VIX/VIX3M at a one-year high of 1.103 and VVIX at 135. A quick drop back under 1.0 would mark this as a one-day shock; a second inverted close would point to a longer repricing.
Sources
- Yahoo Finance: Stock market today: Dow plunges 1,800 points, Nasdaq enters correction in AI trade meltdown
- StockTitan: The Stock Market Today, November 5, Closes Sharply Lower as the AI Chip Selloff Spreads
- Fox Business: Stocks plunge as Dem midterm sweep fuels AI regulatory concerns
- BLS: Schedule of Selected Releases for November 2026
- FedRateCalc: November 2026 U.S. Economic Calendar
- Earnings Whispers: Earnings calendar, November 6, 2026
- Earnings Whispers: Earnings calendar, November 9, 2026
- Earnings Whispers: Earnings calendar, November 12, 2026
Volatility data: ilovevol.app. GEX assumes dealers are long calls and short puts. VIX futures use settlement prices. Implied moves are approximations from expiry ATM IV. Vol Sentiment: ilovevol.app cross-asset score (0 = stress, 100 = calm), one-year window unless noted; day-over-day changes use the latest (revised) prior row.
This review is for informational and educational purposes only and is not investment advice. See the disclaimer.
The Daily Vol sends this review to your inbox each trading day: dealer gamma levels, the VIX curves, the SPX vol surface and the levels to watch. Free, one click to unsubscribe.