Home › Blog › Daily Market Review
Daily Market Review · US close
Post-midterm rally flips dealer gamma to +$32.7B as VIX drops 4.2 points to 16.6
SPX jumped 1.58% to 7,689 after Democrats took both chambers, closing 30 points above the 7,659 flip as net GEX swung from −$42.7B to +$32.7B. VIX1D halved to 12.1 and the VIX curve is back in contango. Friday's jobs-day expiry is now the richest near-term point at 14.7%.
- Democrats were projected to win both the House and Senate, and stocks read the result as an end to uncertainty: the Dow gained 3.0%, SPX +1.58% to 7,689, NDX +0.91%. Oil fell more than 8% and AI data-center names lagged while Amazon, Microsoft and Apple led.
- Net GEX swung from −$42.7B to +$32.7B, and SPX closed 30 points above its 7,659 flip. It sits just above the weekly flip (7,682) and 3 points under the monthly flip (7,692), with the 7,700 call wall in both windows right overhead.
- VIX fell 4.22 to 16.61 and VIX1D halved to 12.08. The Nov 4 expiry priced about 132 points and SPX moved 120, so the event premium was mostly earned. Spot VIX now sits 1.13 under the November future, and Friday's jobs-day expiry carries the highest near-term ATM vol at 14.7%.
Scoreboard
| Close | Chg | Prev | |
|---|---|---|---|
| SPX | 7,689 | +1.58% | 7,569 |
| NDX | 28,437 | +0.91% | 28,180 |
| VIX | 16.61 | −4.22 | 20.83 |
| VIX1D | 12.08 | −11.14 | 23.22 |
| VVIX | 90.4 | −17.0 | 107.4 |
| VX Nov / Dec | 17.74 / 17.98 | +1.35% M1→M2 | −1.77% |
| VIX / VIX3M | 0.884 | −0.095 | 0.979 |
| 30D ATM IV / skew | 13.0% / 10.5 | −3.2 / −2.8 | 16.2% / 13.3 |
| Window | Net GEX | Chg | Prev | Flip | Call wall | Put wall | |
|---|---|---|---|---|---|---|---|
| SPX | All | +$32.7B | +$75.4B | −$42.7B | 7,659 | 8,000 | 7,000 |
| SPX | Weekly | +$8.0B | +$29.1B | −$21.1B | 7,682 | 7,700 | 7,650 |
| SPX | Monthly | +$7.8B | +$53.3B | −$45.5B | 7,692 | 7,700 | 7,600 |
| NDX | All | −$1.07B | +$0.09B | −$1.16B | 28,740 | 29,675 | 28,000 |
| NDX | Weekly | −$0.37B | +$0.06B | −$0.43B | 28,738 | 28,500 | 28,000 |
| NDX | Monthly | −$0.88B | +$0.02B | −$0.90B | 28,757 | 29,675 | 27,500 |
Dealer gamma by expiry window. All = every listed expiry; Weekly = contracts expiring within 7 calendar days; Monthly = within 30 days. Net GEX in $ per 1% move.
1. The tape: a Democratic sweep and the biggest post-midterm rally in decades
Democrats were projected to win control of both chambers of Congress, with several House races still uncalled. Markets treated the outcome as the end of a long period of uncertainty and as a likely recipe for gridlock. The Dow jumped 1,569 points, or 3.03%, to 53,356, its biggest post-midterm gain in 44 years according to The Motley Fool. The S&P 500 rose 1.58% to 7,689, the Nasdaq Composite 1.44% to 25,737, the Nasdaq-100 0.91% to 28,437 and the Russell 2000 1.58% to 2,857. Midday, close to 380 S&P 500 members were higher.
Leadership was unusual. Amazon, Microsoft and Apple each rose roughly 6–7% late in the session, while Nvidia slipped and AI data-center names such as CoreWeave fell sharply after the projected winner of the Texas governor race pledged to pause new data centers. Health insurers and hospital operators rallied. Energy was the weakest sector as WTI crude fell 8.4% to about $88, its steepest drop in weeks. Gold rose about 3.3% to near $4,072, and the 10-year yield fell about 6 basis points to 4.89%.
Among earnings, CVS fell about 12% after announcing a plan to split into two companies, Datadog dropped about 14% on a flat revenue outlook and FIS lost about a quarter of its value after cutting guidance. McDonald's and Uber gained. ADP reported 86,000 private jobs in October, above the roughly 75,000 expected, and the September trade deficit narrowed slightly to $105.0 billion. Qualcomm, AppLovin, DoorDash and Arm reported after the close.
Why it matters for vol: the event that the front end had been priced for is behind us, and the market moved roughly the amount options implied. The premium did not get punished by a quiet tape; it simply expired. What remains is a normal, upward-sloping curve with the jobs report and CPI as the next two dates.
2. Dealer gamma: from short to long in one session
Net GEX across all expiries swung from −$42.7B to +$32.7B per 1% move. Part of that is mechanical: the rally carried SPX through the 7,600–7,690 strikes, and the collapse in implied vol concentrates gamma near spot. The flip edged down to 7,659 (7,663 on Tuesday) and SPX closed 30 points above it, after closing 94 points below it the day before.
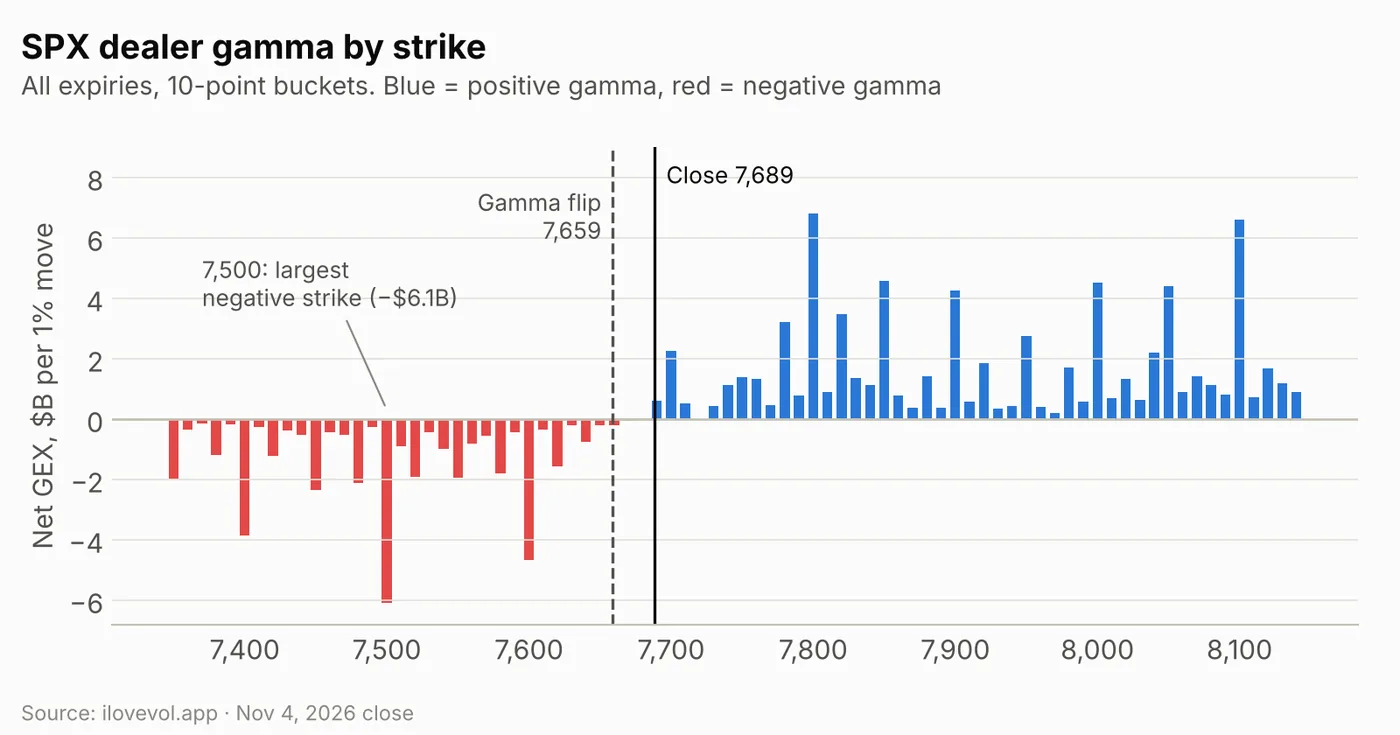
Below the flip, every bucket is still negative: 7,500 (−$6.1B) is the largest, then 7,600 (−$4.7B), 7,400 (−$3.9B) and 7,300 (−$3.6B). Above spot the picture changed completely. The first positive bucket is 7,690, right at the close, and the largest call-side buckets are 7,800 (+$6.8B), 8,100 (+$6.6B), 7,850 (+$4.6B) and 8,000 (+$4.5B).
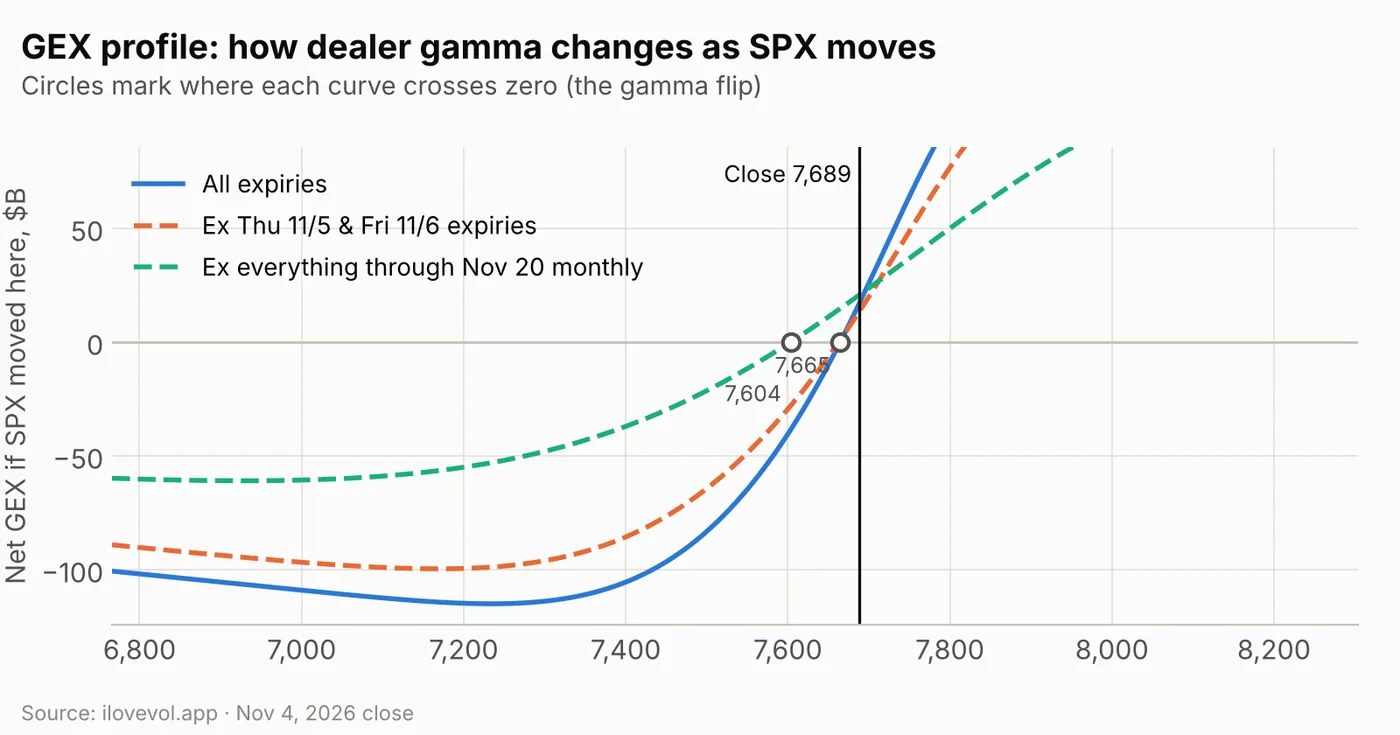
The modeled profile crosses zero near 7,665, close to the site's 7,659 flip, and reads about +$17B at the close. The slope is steep on both sides: modeled gamma rises quickly above 7,700 and falls just as quickly below 7,650, reaching a low of about −$115B near 7,240.
This week's two remaining expiries matter less now. Without Nov 5 and Nov 6, modeled gamma at spot is about +$13.5B with a flip near 7,663, almost the same as the full book.
The longer-dated book turned long. Without everything through the Nov 20 monthly, gamma at spot is about +$20.6B with a flip near 7,604, 85 points under the close. On Tuesday the same curve was slightly negative at spot.
Weekly vs monthly: most of the long gamma sits beyond 30 days
All three SPX windows flipped from negative to positive (numbers in the dealer-gamma table under the scoreboard), but their flips are bunched tightly between 7,659 and 7,692, so the close sits at the top edge of a narrow band rather than well inside long-gamma territory.
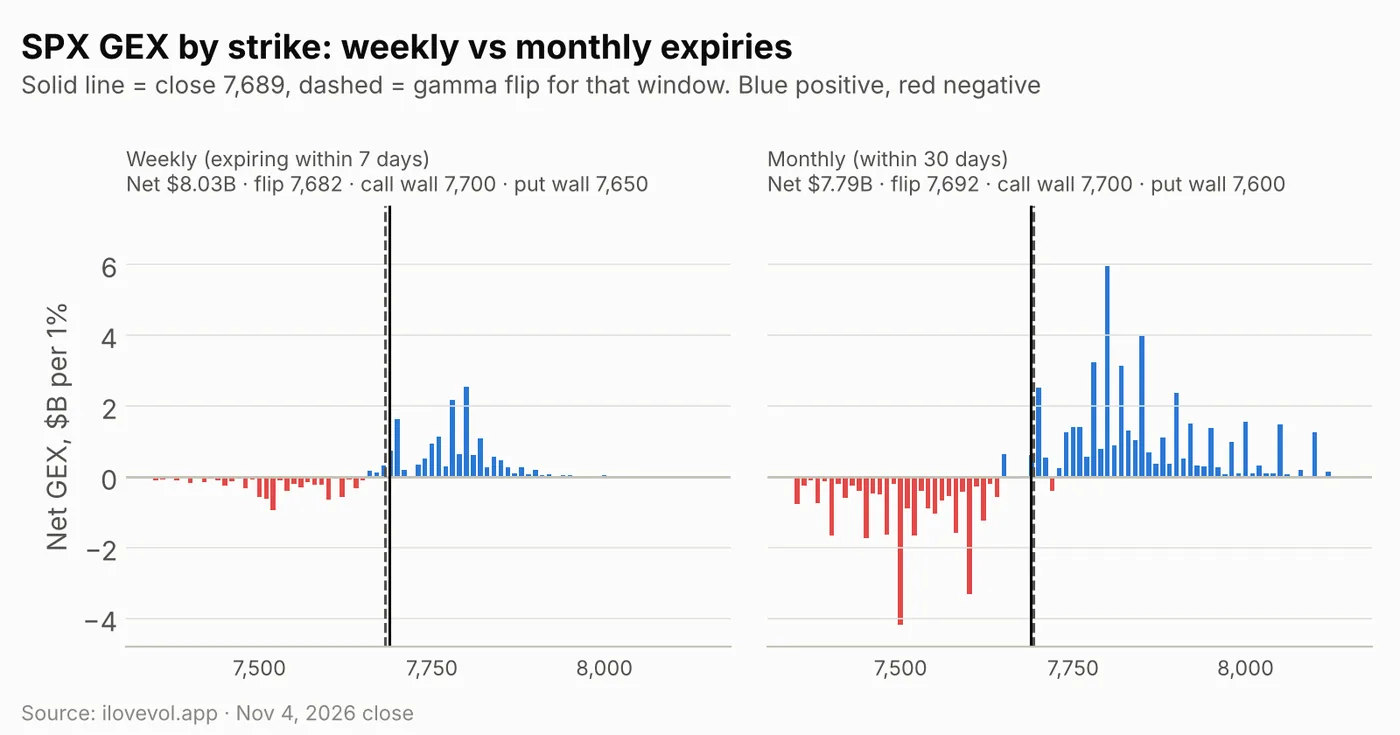
SPX weekly: the next 7 days hold +$8.0B, from −$21.1B, about a quarter of the total. The window covers five expiries, Nov 5 to Nov 11, including the jobs report and CPI. Its flip is 7,682, 7 points under the close. The call wall moved up to 7,700 (7,650 on Tuesday), and the put wall to 7,650 (7,550). The largest weekly buckets are 7,800 (+$2.5B) and 7,780 (+$2.2B) on the call side and 7,520 (−$0.9B) on the put side.
SPX monthly: the 30-day window is +$7.8B (−$45.5B on Tuesday), with the flip at 7,692, 3 points above the close, the call wall at 7,700 and the put wall at 7,600. Its largest buckets are 7,800 (+$6.0B) and 7,500 (−$4.2B). Since the monthly window is only slightly larger than the weekly one, expiries 8–30 days out net close to zero, and expiries beyond 30 days carry about +$24.9B (+$2.8B on Tuesday). That longer-dated book is now the main source of the cushion.
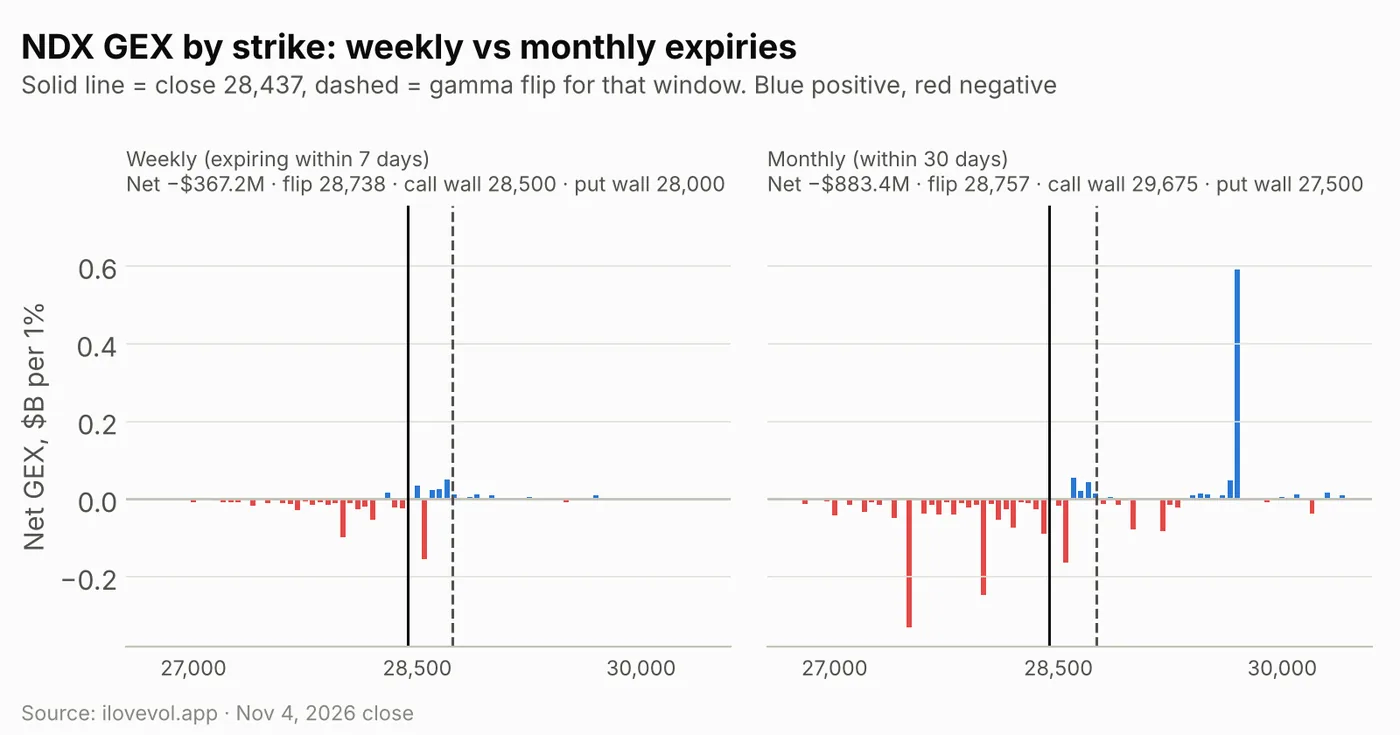
NDX lagged with a 0.91% gain to 28,437, held back by Nvidia and the data-center names, and its gamma barely moved: −$1.07B from −$1.16B. It closed 303 points under its 28,740 flip. Weekly is −$0.37B (flip 28,738, call wall 28,500, put wall 28,000) and monthly −$0.88B (flip 28,757, call wall 29,675, put wall 27,500). The monthly book's largest buckets are still 29,700 (+$0.59B) and 27,500 (−$0.33B). Unlike SPX, dealers in NDX are still short gamma in every window.
RUT gained 1.58% to 2,857 and its gamma turned positive at +$1.11B (−$0.54B on Tuesday). It closed 27 points above its 2,830 flip, just under the 2,860 call wall, with the put wall at 2,800.
3. The VIX complex: the front end collapses
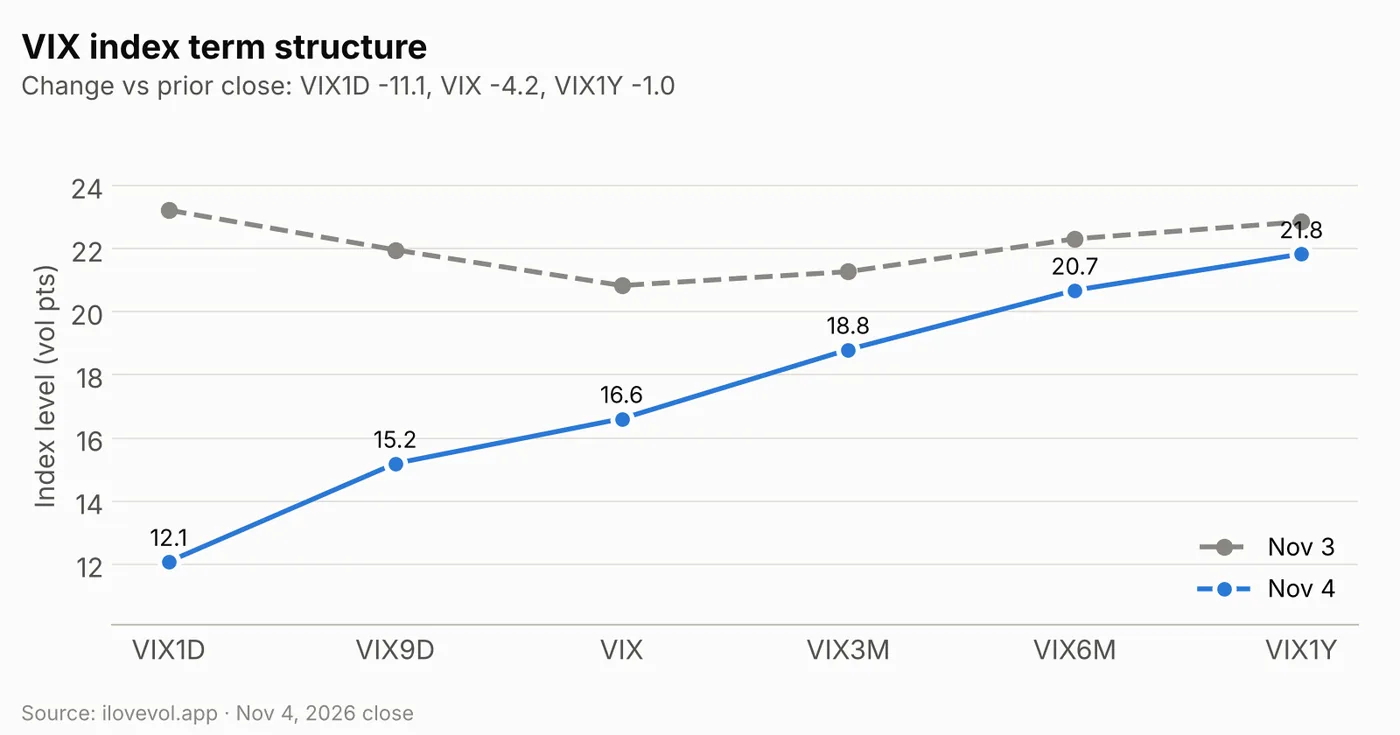
The index curve went from a hump at the front to a clean upward slope. VIX1D fell 11.14 to 12.08, now the lowest point on the curve, followed by VIX9D at 15.19 (−6.77) and VIX at 16.61 (−4.22). The declines shrink with maturity: VIX3M fell 2.47 to 18.80, VIX6M 1.63 to 20.68 and VIX1Y 1.02 to 21.83.
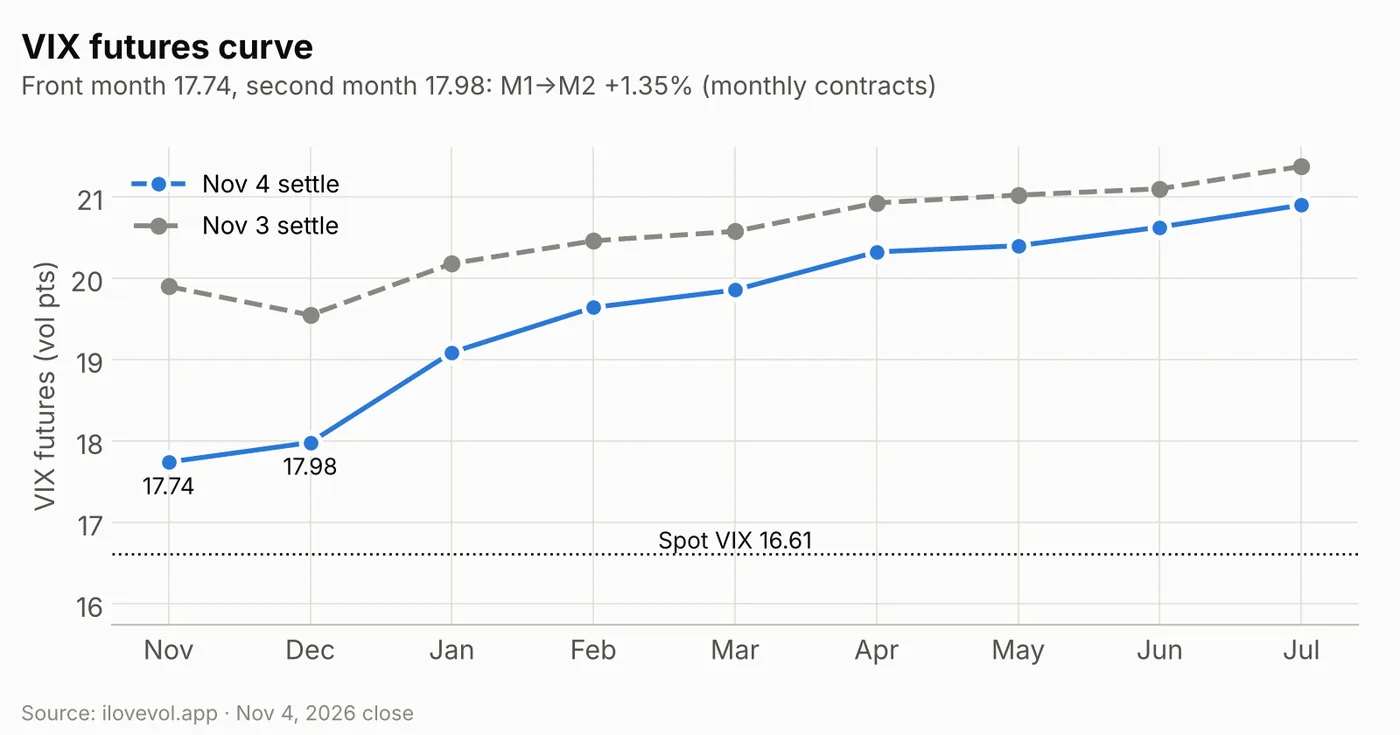
Futures fell less than spot. November settled at 17.74 (−2.16) and December at 17.98 (−1.57), so M1→M2 is back in contango at +1.35% (−1.77% on Tuesday). January fell 1.09 to 19.09 and July 0.48 to 20.90. Spot VIX is now 1.13 points under the November contract, which settles on Nov 18, after sitting 0.93 above it on Tuesday: futures now price VIX somewhat higher by mid-November than today's spot. VVIX dropped 17.0 to 90.4.
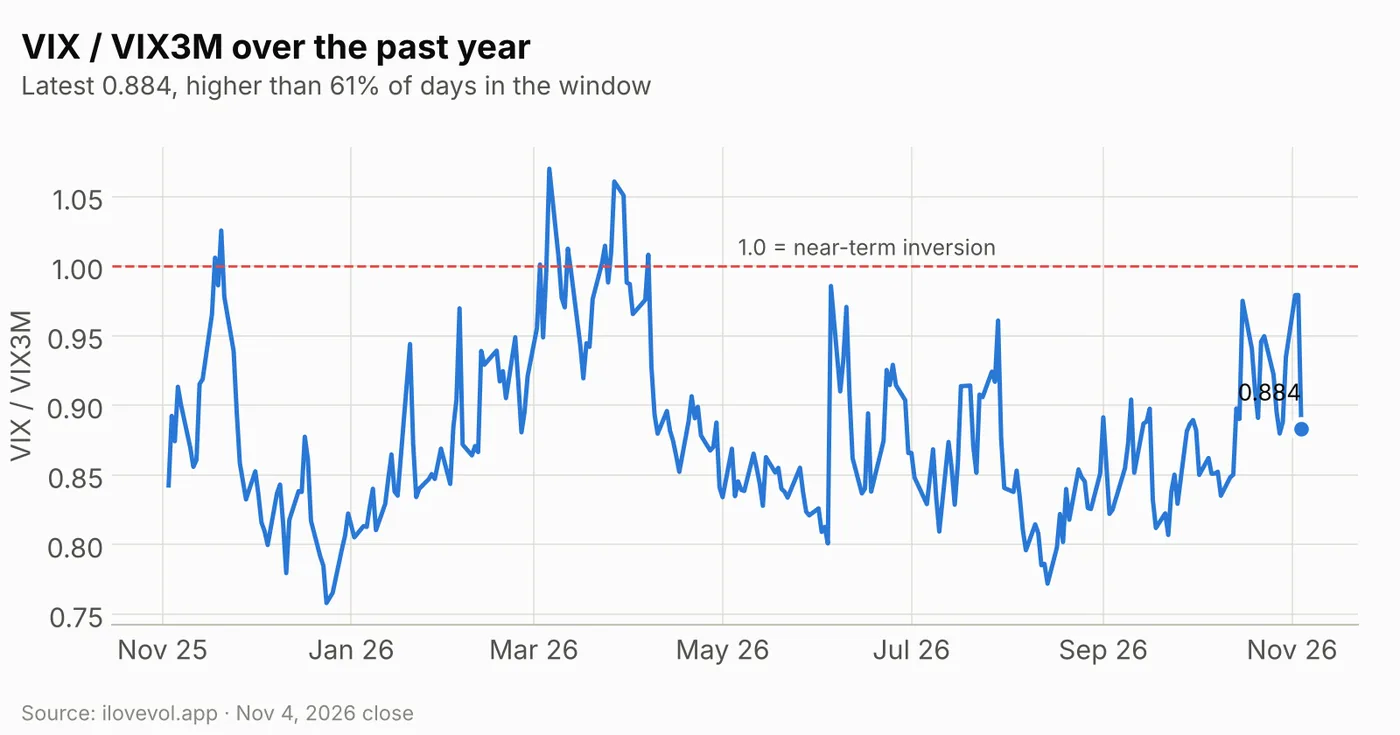
VIX/VIX3M fell to 0.884 from 0.979, higher than 61% of the past year's sessions, down from the 92nd percentile a day earlier and well away from the 1.0 inversion line.
4. Implied vs realized: the cushion halves
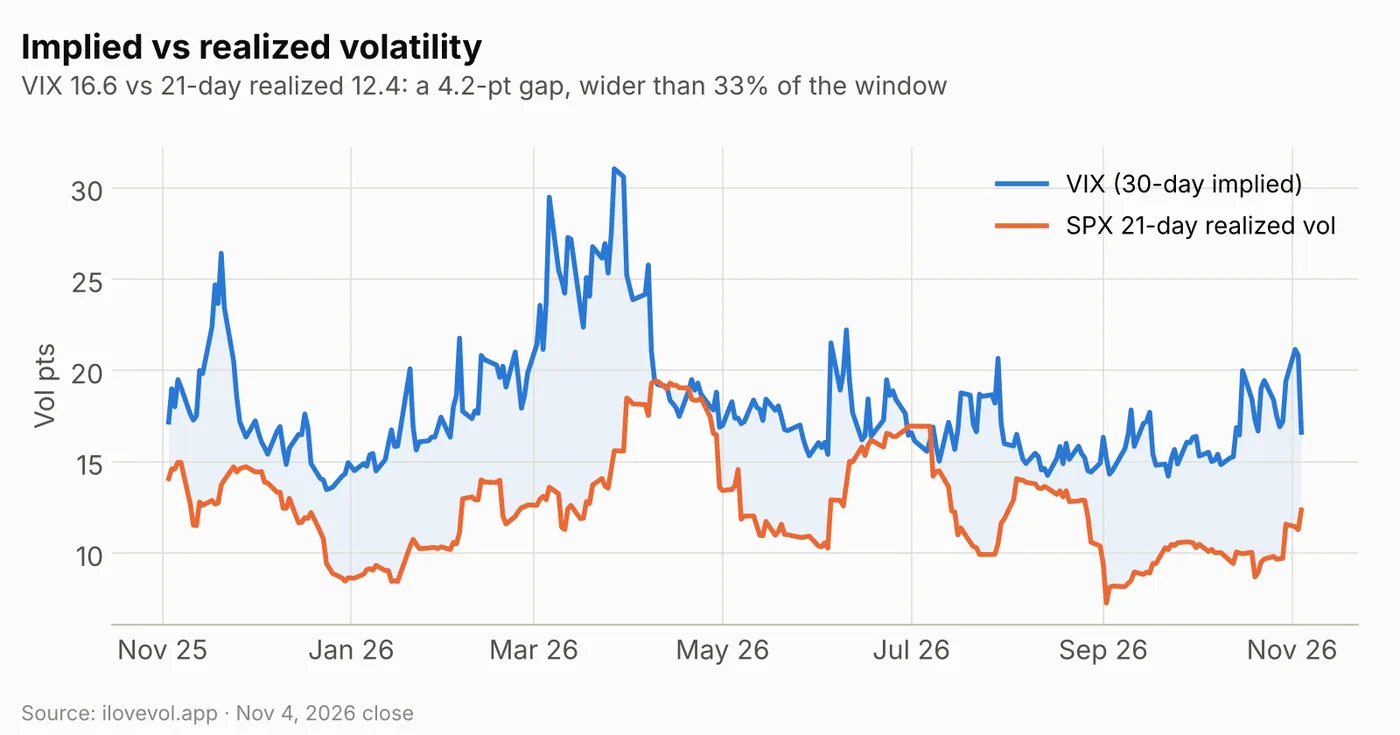
SPX 21-day realized vol rose to 12.4 from 11.3 as the 1.58% move entered the window. With VIX at 16.6, the gap is 4.2 points, down from 9.5 on Tuesday and wider than only 33% of the past year. Thirty-day ATM implied vol, at 13.0%, is now less than a point above realized: the extra premium that options carried into the vote is largely gone.
5. SPX surface: Friday is the new high point
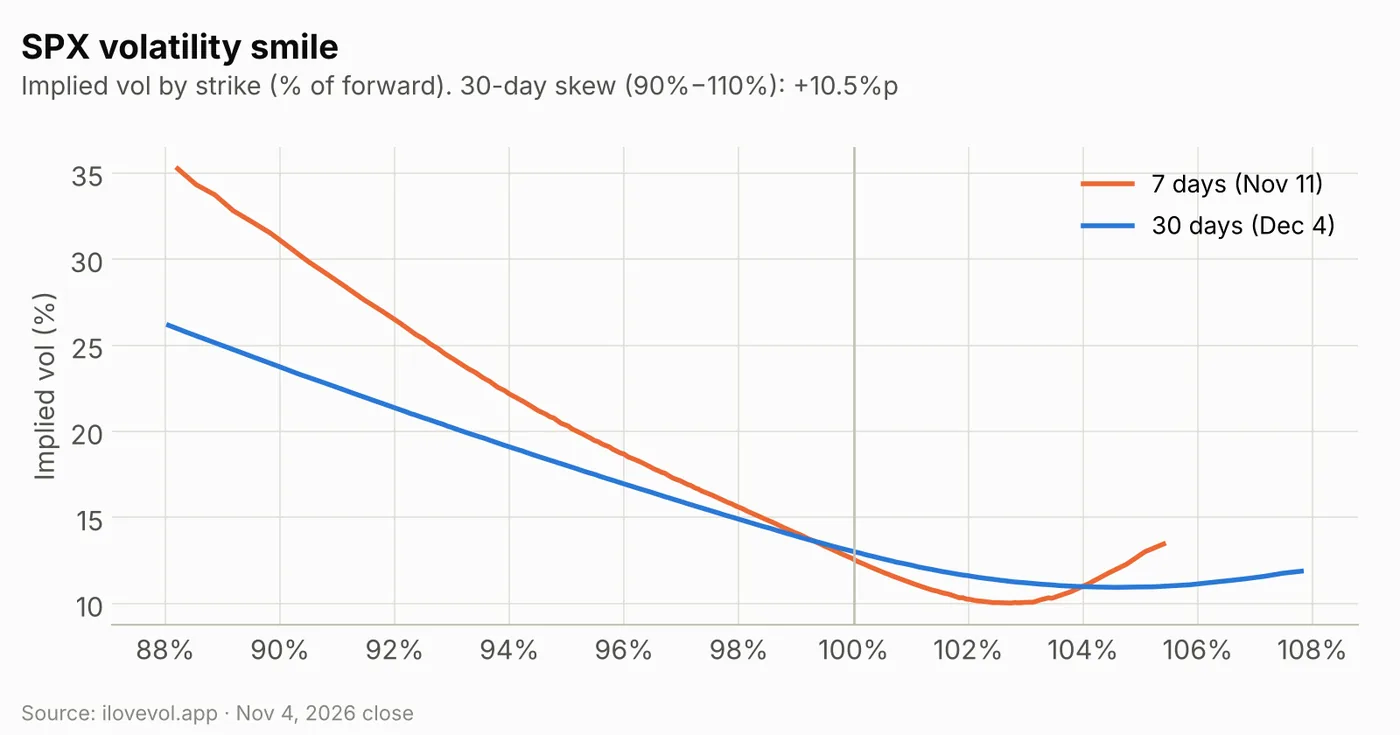
Thirty-day ATM IV fell to 13.0% from 16.2%, and 30-day skew (90% vs 110%) eased to 10.5 points from 13.3. The 90-day minus 30-day slope turned positive at +0.9 points, from −0.5. The 7-day smile (Nov 11) runs from about 35% at 88% to a low near 10% around 103%, with the call wing lifting again past 104%; the 30-day curve (Dec 4) runs from about 26% at 88% to a flat call side near 11–12%.
Wednesday's expiry priced about a 132-point move and SPX moved 120. Next up, ATM IV is 13.3% for Thursday Nov 5 (about 64 points) and 14.7% for Friday Nov 6, jobs day, the highest of the next two weeks: about 100 points through Friday, or roughly 77 for Friday alone. After that the curve drops to 11.5% for Nov 9 and 12.3% for Nov 10 (CPI); the Nov 20 monthly is 13.0%.
6. Cross-asset Vol Sentiment: US equities leave the stressed zone
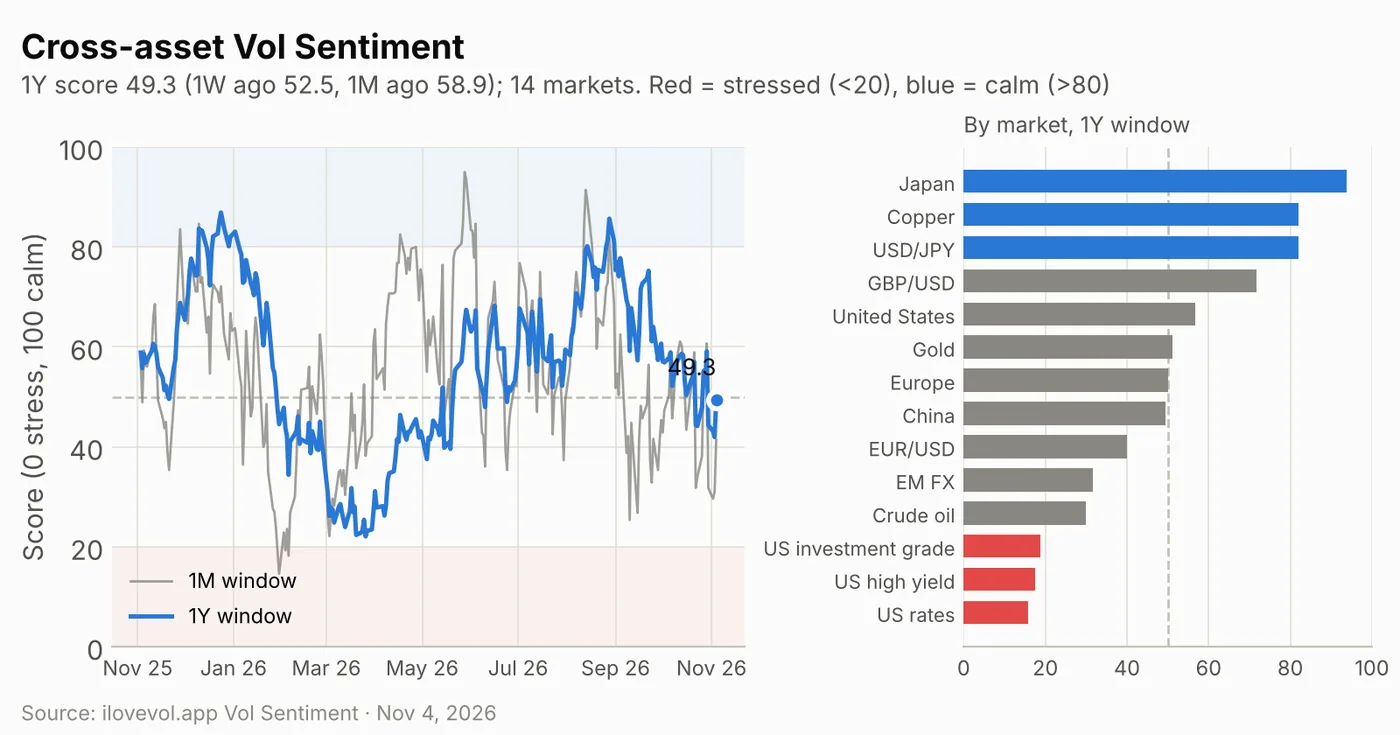
The cross-asset Vol Sentiment score places volatility in 14 equity, currency, rates, credit and commodity markets within its own one-year range (0 = stress, 100 = calm). On the one-year window it rose to 49.3 from 42.0 on Tuesday, close to the 50 midpoint but still below 52.5 a week ago and 58.9 a month ago, and higher than 34% of the past year's sessions. The shorter windows improved more: 41.4 on one month (from 31.1) and 29.9 on three months (from 23.7).
The biggest change is US equities, which jumped to 56.7 from 14.2 and left the stressed zone. Three markets remain under 20, all US fixed income: rates (15.8), high yield (17.5) and investment grade (18.8). Japan (93.8), copper (82.1) and USD/JPY (82.1) are in the calm zone, while GBP/USD fell to 71.7 and crude oil sits at 30.0. Next to the SPX picture, the relief is concentrated in equity vol; rates and credit vol have not followed yet. It is context, not a trading signal.
Calendar: the week ahead
Economic data & Fed
| Date | Time (ET) | Event | Note |
|---|---|---|---|
| Thu Nov 5 | 7:00 (expected) | Bank of England decision | |
| Thu Nov 5 | 8:30 | Jobless claims; Q3 productivity and unit labor costs | Nov 5 expiry 13.3% ATM (about 64 pts); Fed's Hammack and Barkin speak (times –) |
| Fri Nov 6 | 8:30 | October jobs report | Nov 6 expiry 14.7% ATM, the highest near-term point |
| Fri Nov 6 | 10:00 (expected) | University of Michigan sentiment (Nov, prelim) | |
| Fri Nov 6 | 12:15 | Fed Vice Chair for Supervision Bowman speaks | Logan, Williams and Musalem also speak (times –) |
| Tue Nov 10 | 8:30 | October CPI; real earnings | Nov 10 expiry 12.3% ATM vs 11.5% Nov 9 |
| Thu Nov 12 | 8:30 | Jobless claims | |
| Fri Nov 13 | 8:30 | PPI (Oct) | Nov 13 expiry 13.0% ATM |
| Wed Nov 18 | 14:00 | FOMC minutes (Oct 27–28 meeting) |
Earnings
| Date | Timing | Companies | Note |
|---|---|---|---|
| Wed Nov 4 | After close | Qualcomm, Arm, AppLovin, DoorDash | Reaction in the Nov 5 expiry |
| Thu Nov 5 | Before open | ConocoPhillips, Cigna, Duke Energy, Southern Co., Zoetis, Sony | |
| Thu Nov 5 | After close | Cloudflare, Atlassian, Instacart, Lumentum | |
| Fri Nov 6 | Before open | Charter, Moderna, Humana, Vistra | Same morning as the jobs report |
| Mon Nov 9 | Before open | Constellation Energy, KKR | |
| Mon Nov 9 | After close | CoreWeave (expected), Take-Two, Occidental | Data-center sentiment after Wednesday's selloff |
| Thu Nov 12 | After close | Cisco, Applied Materials |
Volatility dates (expirations, events)
| Date | Event | Note |
|---|---|---|
| Thu Nov 5 | SPX expiry after Qualcomm and Arm | 13.3% ATM, about 64 pts |
| Fri Nov 6 | Weekly SPX expiry with the jobs report | 14.7% ATM, about 100 pts priced through Nov 6 |
| Tue Nov 10 | SPX expiry on CPI day | 12.3% ATM, about 146 pts priced through Nov 10 |
| Wed Nov 11 | Veterans Day: stocks open, bond market closed | |
| Wed Nov 18 | VIX November futures and options expiration | Nov future 17.74, 1.13 above spot VIX (16.61) |
| Fri Nov 20 | SPX November monthly expiration | 13.0% ATM; without everything through it, modeled gamma at spot is about +$20.6B |
| Thu Nov 26 / Fri Nov 27 | Thanksgiving (closed) / 1:00 pm early close |
What I'm watching
- 7,659–7,692. The all-expiry flip (7,659), the weekly flip (7,682) and the monthly flip (7,692) are only 33 points apart, and SPX closed at 7,689, inside the top of that band. A hold above 7,692 leaves dealers long gamma in every window; a drop back under 7,659 puts them short again.
- 7,700 overhead. It is the call wall in both the weekly and monthly windows, 11 points above the close, with the larger call-side buckets at 7,780–7,800 (+$6.8B at 7,800) behind it.
- 7,650, 7,600 and 7,500 below. The weekly put wall is 39 points under the close, the monthly put wall at 7,600 is also a −$4.7B bucket, and 7,500 (−$6.1B) is still the largest negative strike. The modeled profile falls steeply below 7,650.
- Friday's 14.7%. The jobs-day expiry prices about 77 points for Friday alone and 100 through Friday. Wednesday's expiry priced 132 and delivered 120; a jobs report that moves SPX less than that would leave the front end with little premium left before CPI.
- Spot VIX under the November future. VIX 16.61 vs 17.74 for November and contango of +1.35%, with VIX/VIX3M at 0.884 and the IV-RV gap down to 4.2 points. Either spot drifts back up toward the futures or the futures roll down toward spot by the Nov 18 settlement.
Sources
- TheStreet: Stock Market Today (Nov. 4, 2026): Stocks rise, oil collapses after Dems sweep midterm elections
- Yahoo Finance / The Motley Fool: Stock Market Today, Nov. 4: Dow Surges 3% in Biggest Post-Midterm Rally in 44 Years
- StockTitan: Stock Market Today Live, November 4, 2026
- Charles Schwab: Stocks Surge: Big Democratic Win Eases Uncertainty
- BLS: Release schedule, November 2026
- FatTail: Week Ahead, Nov 2–6, 2026
- Earnings Whispers: Earnings calendar, November 5, 2026
- Earnings Whispers: Earnings calendar, November 12, 2026
Volatility data: ilovevol.app. GEX assumes dealers are long calls and short puts. VIX futures use settlement prices. Implied moves are approximations from expiry ATM IV. Vol Sentiment: ilovevol.app cross-asset score (0 = stress, 100 = calm), one-year window unless noted.
This review is for informational and educational purposes only and is not investment advice. See the disclaimer.
The Daily Vol sends this review to your inbox each trading day: dealer gamma levels, the VIX curves, the SPX vol surface and the levels to watch. Free, one click to unsubscribe.