Home › Blog › Daily Market Review
Daily Market Review · US close
SPX clears its 7,700 gamma flip and dealers swing to long gamma ahead of the Fed
SPX rose 0.6% to 7,723 and net GEX swung from −$22.6B to +$18.3B. VIX eased to 17.5, but the Wednesday–Friday expiries still price 14.5–15.9% ATM vol for the FOMC, GDP/PCE and megacap earnings. Here are the levels for Wednesday.
- Chips led a second day of AI-driven gains: SPX +0.6% to 7,723, NDX +1.3% and the Russell 2000 +1.2%, while the Dow was flat with Boeing down about 10%. October consumer confidence jumped to 91.7, well above forecasts.
- SPX closed 23 points above its 7,700 flip and net GEX swung from −$22.6B to +$18.3B. The weekly window is now roughly flat (−$0.7B); the long gamma sits in expiries more than 30 days out.
- VIX fell 0.87 to 17.52, but VIX1D rose 2.0 to 12.5 now that FOMC day is in its window. The Oct 28–30 expiries price 14.5–15.9% ATM vol vs 12.7–12.9% for Nov 2–3.
Scoreboard
| Close | Chg | Prev | |
|---|---|---|---|
| SPX | 7,723 | +0.60% | 7,677 |
| NDX | 29,651 | +1.29% | 29,273 |
| VIX | 17.52 | −0.87 | 18.39 |
| VIX1D | 12.53 | +2.04 | 10.49 |
| VVIX | 99.5 | −2.0 | 101.4 |
| VX Nov / Dec | 18.95 / 19.07 | +0.61% M1→M2 | +0.19% |
| VIX / VIX3M | 0.895 | −0.027 | 0.922 |
| 30D ATM IV / skew | 13.7% / 11.0 | −0.6 / −0.9 | 14.3% / 11.9 |
| Window | Net GEX | Chg | Prev | Flip | Call wall | Put wall | |
|---|---|---|---|---|---|---|---|
| SPX | All | +$18.3B | +$40.9B | −$22.6B | 7,700 | 8,000 | 7,000 |
| SPX | Weekly | −$0.7B | +$23.8B | −$24.5B | 7,722 | 7,800 | 7,700 |
| SPX | Monthly | −$7.4B | +$33.6B | −$41.0B | 7,733 | 8,000 | 7,700 |
| NDX | All | +$0.55B | +$0.97B | −$0.42B | 29,496 | 29,675 | 28,000 |
| NDX | Weekly | +$0.47B | +$0.40B | +$0.07B | 29,427 | 30,300 | 29,300 |
| NDX | Monthly | +$1.16B | +$0.77B | +$0.39B | 29,243 | 29,675 | 27,500 |
Dealer gamma by expiry window. All = every listed expiry; Weekly = contracts expiring within 7 calendar days; Monthly = within 30 days. Net GEX in $ per 1% move.
1. The tape: chips extend the AI rebound, confidence surprises
Tech led for a second straight session as chipmakers and AI names kept rallying, with Anthropic's IPO filing still in the background and traders positioning for Wednesday's Fed decision and this week's megacap reports. The S&P 500 rose 0.6% to 7,723, the Nasdaq Composite gained 1.2% to 26,478, the Nasdaq-100 1.3% and the Russell 2000 1.2%. The Dow was flat at 52,378. Small caps keeping pace with the Nasdaq points to broader participation than a megacap-only day.
The Conference Board's consumer confidence index rose to 91.7 in October, its first gain in four months and well above forecasts near 81, as gasoline prices eased. Earnings drove the single-stock moves. SoFi gained about 13% after a third-quarter beat, and Royal Caribbean rose about 7–8% on stronger results and a higher outlook. UPS gained about 2% after raising guidance. Boeing fell about 10% after cutting its delivery target, and Coca-Cola slipped 1.6% despite a higher earnings outlook, as North American volume was flat. Cintas dropped on a report that the FTC plans to sue to block its UniFirst deal. After the close, Visa beat estimates but fell about 2% in extended trading on a slower fiscal 2027 outlook.
Oil eased again on hopes of de-escalation in the Middle East, with WTI ending near $100. The 10-year Treasury yield held near 4.99%, and gold gained about 0.9%. CME pricing still put the odds of a hike on Wednesday near 10%.
Why it matters for vol: the rally took SPX through its gamma flip, so dealer hedging now leans against moves rather than with them. Index implied vol drifted lower, but the premium for Wednesday through Friday is still in place: the market is waiting for the events, not paying less for them.
2. Dealer gamma: across the line
Net GEX across all expiries swung to +$18.3B per 1% move, from −$22.6B on Monday. The flip edged down to 7,700 (from 7,703), and SPX closed at 7,723, 23 points (0.3%) above it. Monday's close was 26 points below. The rally carried SPX across the steepest part of the profile, and Tuesday's expiry rolled off, so a 0.6% move turned into a $41B swing in dealer gamma.
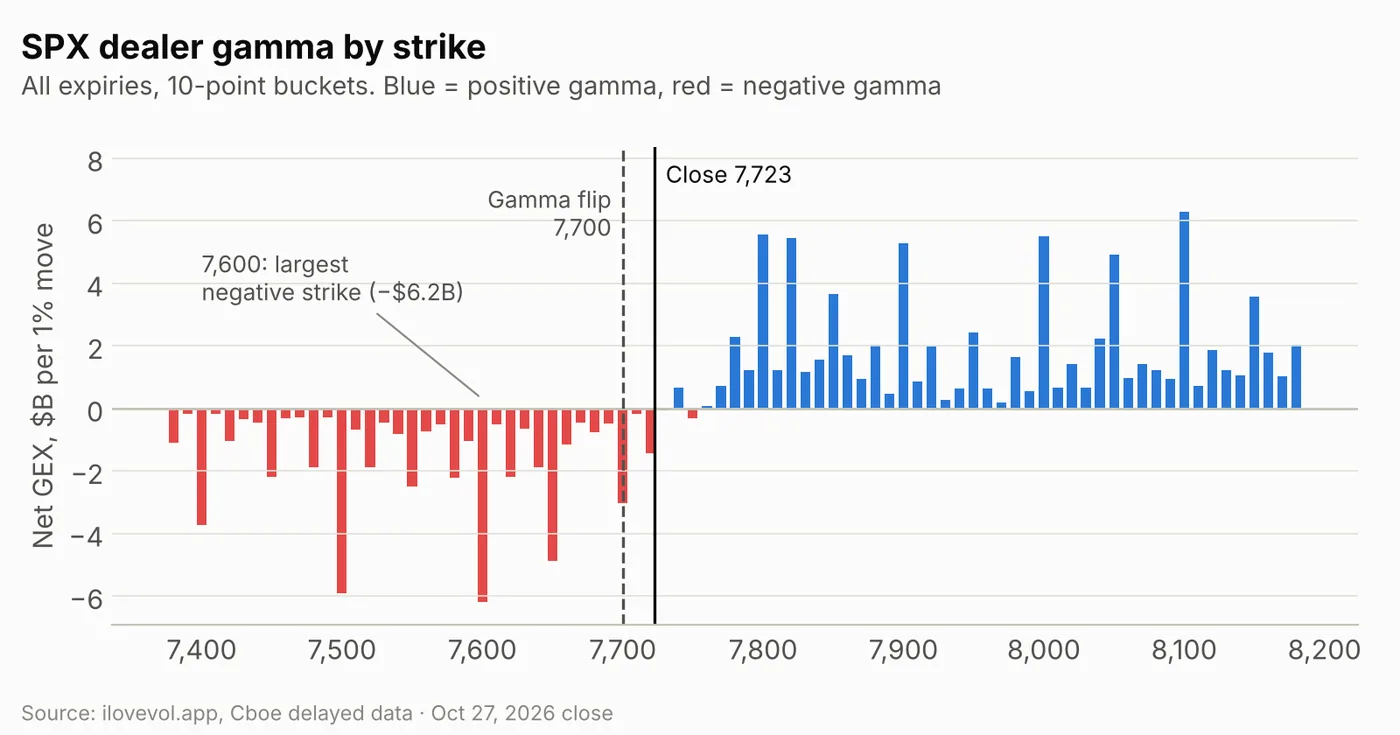
The strike map is split at the close. Every bucket from 7,740 up is positive, led by 8,100 (+$6.3B), 7,800 (+$5.6B), 8,000 (+$5.5B) and 7,820 (+$5.4B). Below spot the negative strikes are unchanged in rank: 7,600 (−$6.2B), 7,500 (−$5.9B), 7,650 (−$4.9B) and 7,400 (−$3.7B).
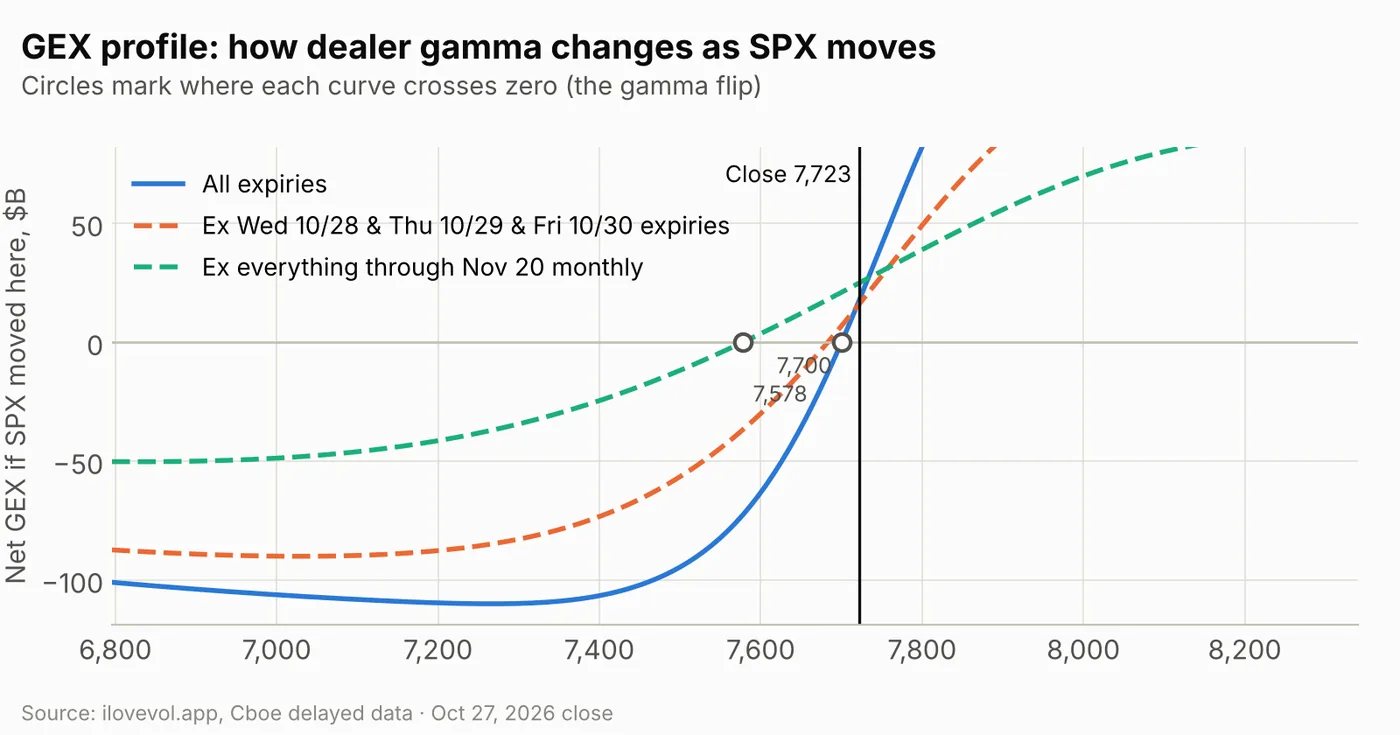
The profile puts all-expiry gamma at today's price near +$18B. Two points:
This week's expiries no longer drive it. Remove the Oct 28–30 expiries and gamma at spot is still about +$16B, with a flip near 7,683. On Monday the same cut left roughly −$2B. The long gamma now comes from further out.
Beyond the November monthly, dealers are longer still. Strip out everything through Nov 20 and gamma at spot is about +$25B, with a flip near 7,578. The downside has not changed: the all-expiry curve still drops to about −$110B near 7,270, so a move back under 7,700 would put dealers short gamma again quickly.
Weekly vs monthly: the short gamma is gone from the front
Splitting gamma by expiry window (net GEX, flip and walls for each window are in the dealer-gamma table under the scoreboard) shows the near-term windows close to flat and their flips sitting right at the close. The positive total comes from expiries more than 30 days out. Weekly = contracts expiring within 7 calendar days; Monthly = within 30 days.
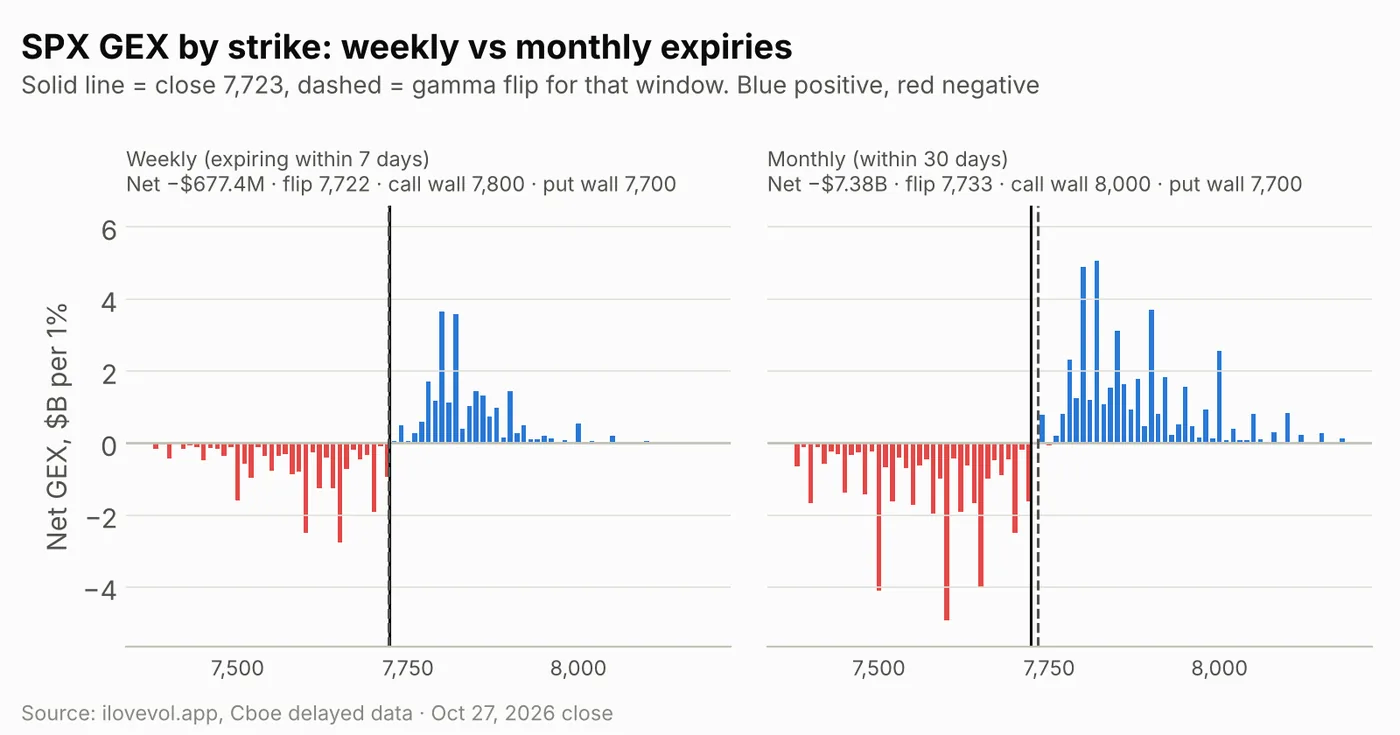
SPX weekly: the next 7 days carry just −$0.7B, down from −$24.5B on Monday. The window holds five expiries, Oct 28 to Nov 3, spanning the FOMC, GDP/PCE and Apple's report. Its flip is 7,722, essentially the close, with the call wall at 7,800 and the put wall at 7,700. That 100-point band is twice Monday's width.
SPX monthly: the 30-day window is −$7.4B (flip 7,733, just 10 points above the close), much less negative than Monday's −$41.0B. The put wall moved up to 7,700 and the call wall is 8,000. Expiries beyond 30 days are net long about $26B, which is what puts the all-expiry total in positive territory.
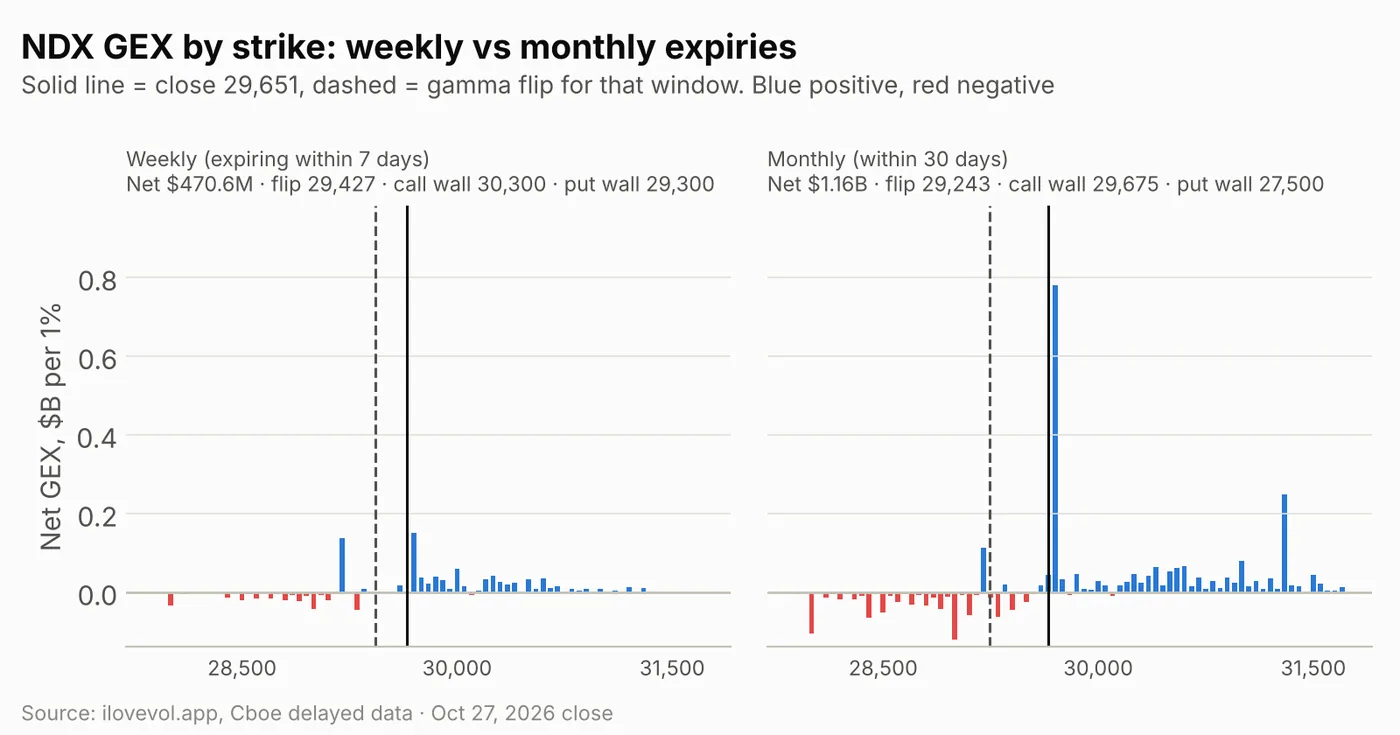
NDX rose 1.3% to 29,651 and is now long gamma across every window: +$0.55B in total (from −$0.42B), 0.5% above its 29,496 flip. The weekly window is +$0.47B with a flip at 29,427, a 29,300 put wall and a 30,300 call wall. The monthly window is +$1.16B (flip 29,243). Its 29,675 call wall is only 24 points above the close, and the largest single positive bucket in that window sits at 29,700. Expiries beyond 30 days are still net short about $0.6B.
RUT gained 1.2% to 2,819 and its short gamma shrank to −$0.28B from −$1.22B. It is 14 points under its 2,833 flip, with a 2,850 call wall and a put wall that moved up to 2,800.
3. The VIX complex: the belly fell, the 1-day rose
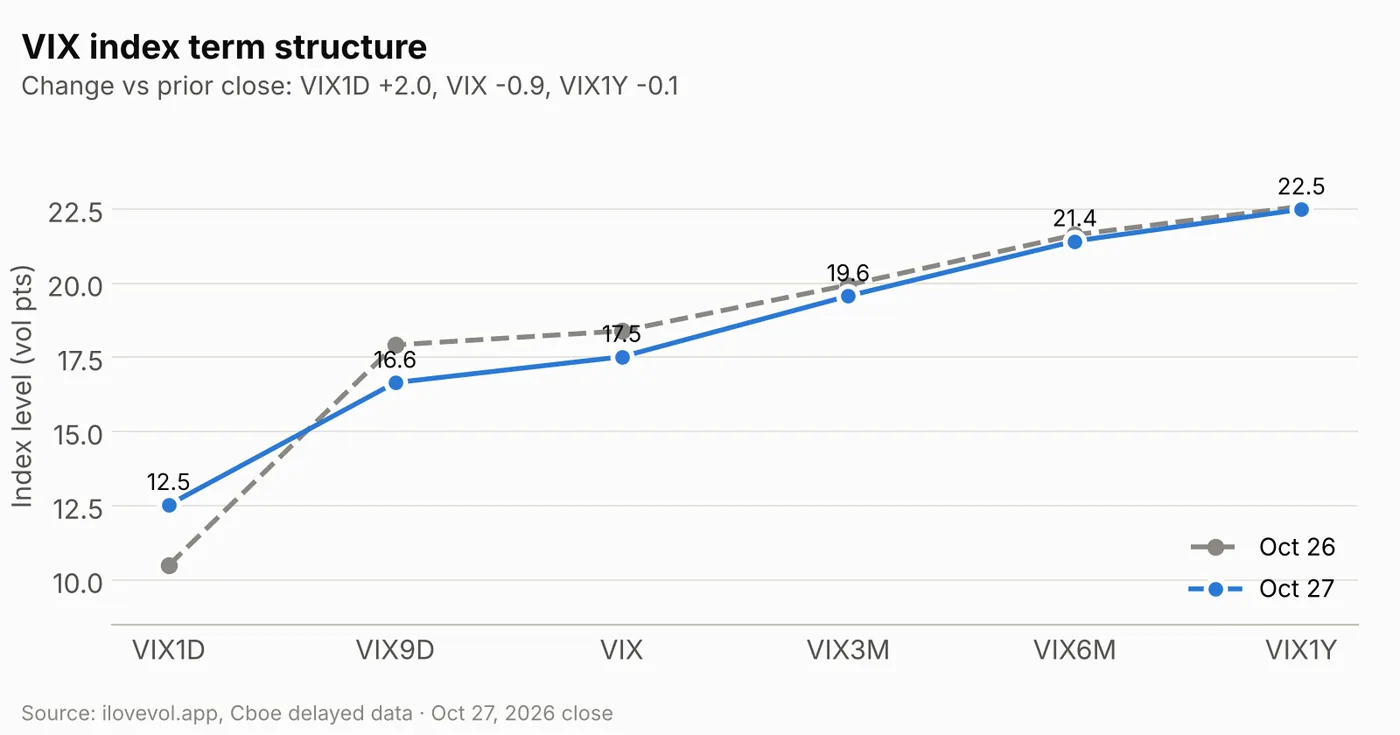
The largest drop was in the middle of the curve. VIX9D fell 1.3 to 16.6 and VIX lost 0.87 to 17.52, while VIX3M slipped 0.4 and VIX1Y only 0.1. VIX1D went the other way, up 2.0 to 12.5, because its window now covers Wednesday's FOMC decision. It is still well below the 14.5% ATM vol the Oct 28 SPX expiry carries.
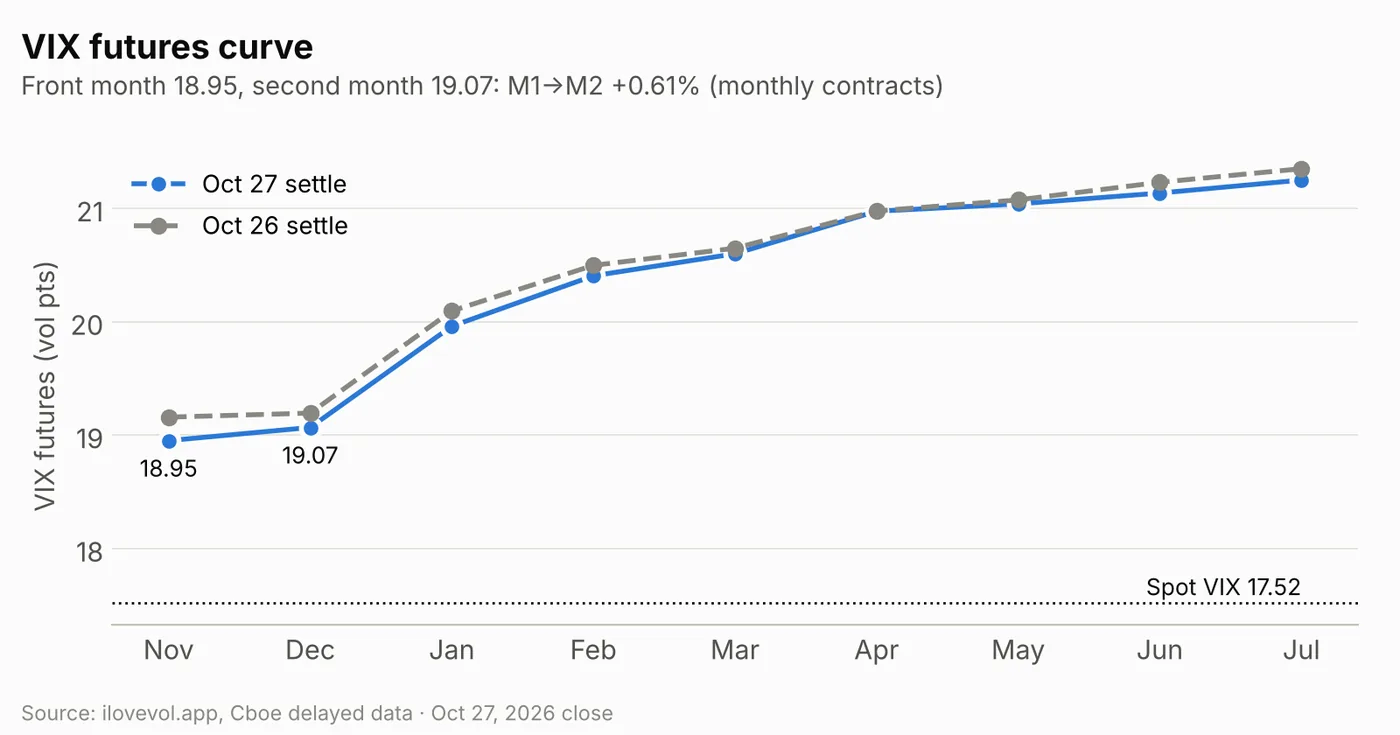
November futures settled at 18.95, down 0.21, and December at 19.07, down 0.13. M1→M2 steepened to +0.61% from +0.19%, so the curve is in contango from the front. Spot fell more than the futures: November now sits about 8.2% above spot VIX, up from 4.2% on Monday, so futures are pricing some vol back in before the November expiry. VVIX eased 2.0 to 99.5, back under 100.
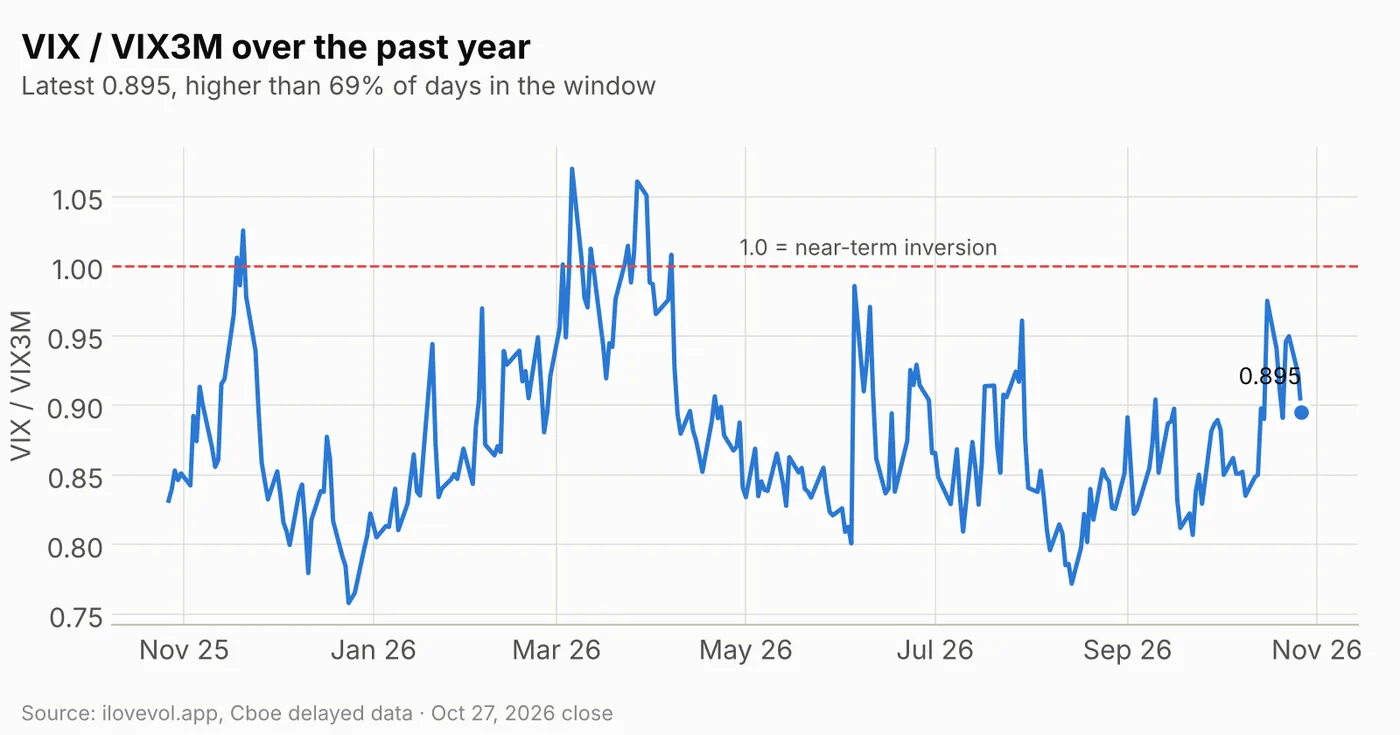
VIX/VIX3M fell to 0.895 from 0.922. That is higher than 69% of the past year's sessions, down from 80% on Monday. The near end is still elevated relative to three months, but the gap is closing.
4. Implied vs realized: still nearly double
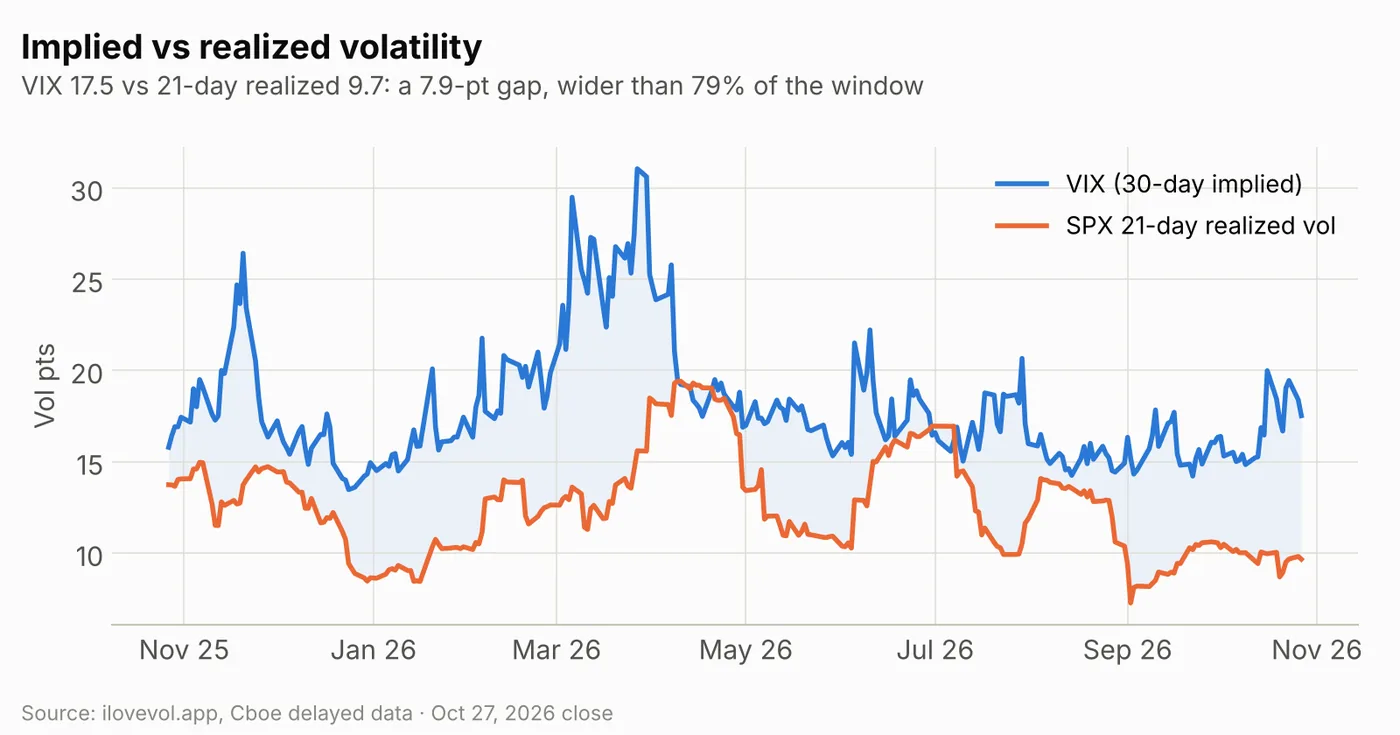
SPX 21-day realized vol is 9.7. With VIX at 17.5, the gap is 7.9 points, down from 8.6 on Monday and wider than 79% of the past year (84% on Monday). Implied is still close to twice what SPX has delivered. Two quiet up days have trimmed the premium without changing the picture.
5. The SPX surface: lower and flatter, event days intact
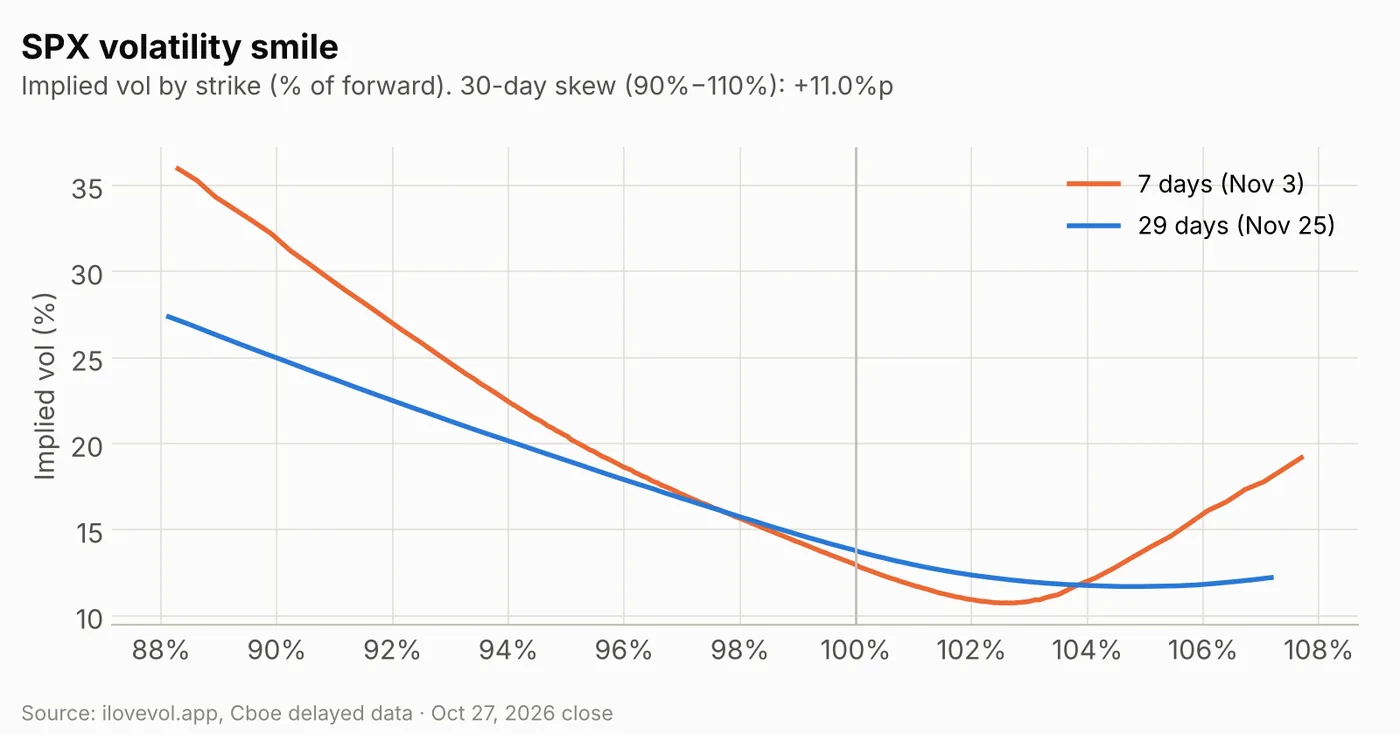
Thirty-day ATM IV fell to 13.7% from 14.3%, and 30-day skew (90% vs 110%) flattened to 11.0 points from 11.9. The 90D−30D term slope steepened to +0.8 points from +0.3, as front vol fell faster than three-month vol. The 7-day smile (Nov 3) is still steep, with 88% puts near 36% vol and the call wing turning up from about 103%. The 29-day curve (Nov 25) is about 27.5% at 88%.
The expiry table still carries the event premium. ATM IV is 14.5% for Wednesday (FOMC), 15.8% for Thursday (GDP and PCE, after Microsoft and Alphabet report) and 15.9% for Friday Oct 30 (after Amazon). Thursday and Friday are only a few tenths lower than on Monday. After that it drops to 12.7% for Nov 2 and 12.9% for Nov 3, then rises to 13.9% for Nov 4, the first expiry after the midterm vote, and 14.2% for Nov 6, the day of the October jobs report.
6. Cross-asset Vol Sentiment: back above 50, but not in fixed income
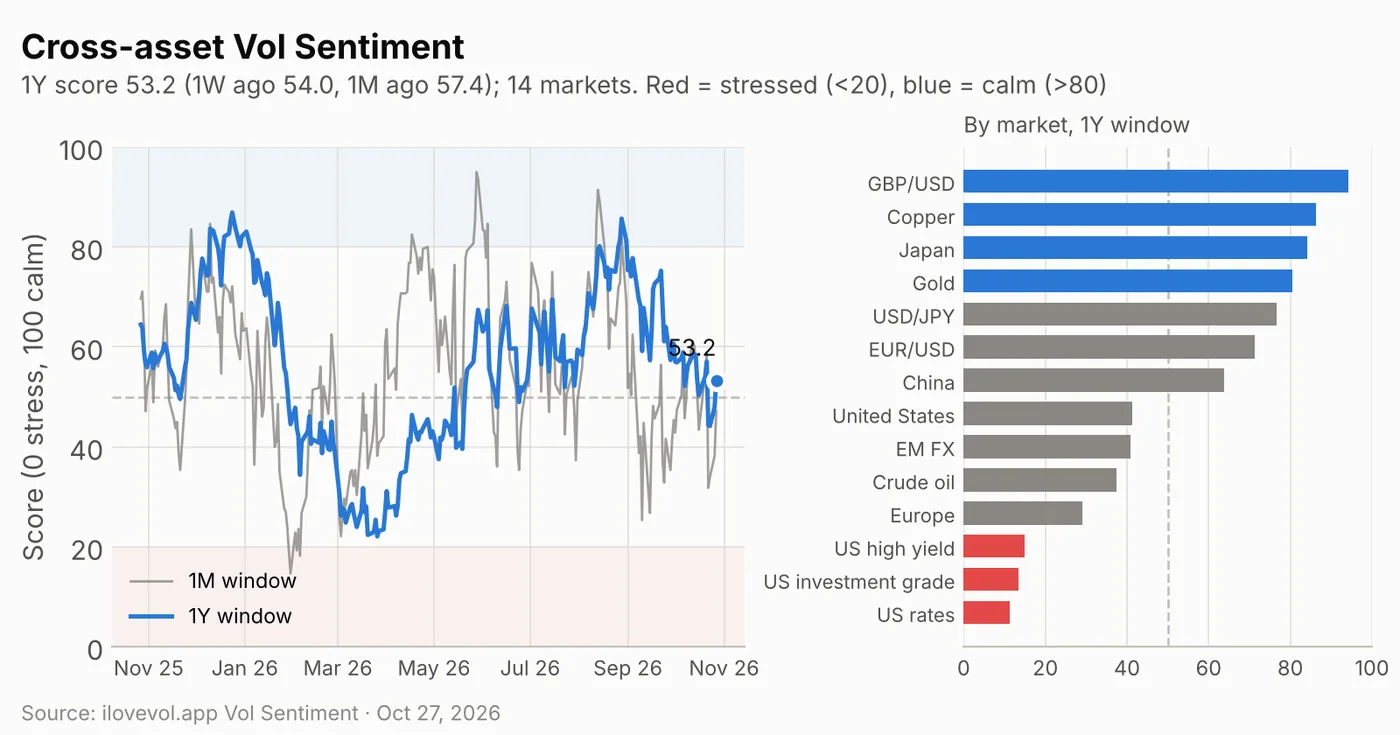
The cross-asset Vol Sentiment score places volatility in 14 equity, currency, rates, credit and commodity markets within its own one-year range (0 = stress, 100 = calm). On the one-year window it rose to 53.2 from 47.9 on Monday, back on the calm side of 50. That is close to 54.0 a week ago and below 57.4 a month ago, and it is higher than only 39% of the past year's sessions. The shorter windows are still below 50: 47.1 on one month and 36.4 on three months.
Fixed income remains the stress point. US rates (11.2), investment grade (13.5) and high yield (15.0) all sit near the top of their one-year vol ranges. US equities score 41.2, ahead of Europe (29.2) and crude oil (37.5). At the calm end are GBP/USD (94.2), copper (86.2), Japanese equities (84.2) and gold (80.4). Next to the SPX picture, this says the equity calm is not shared by rates and credit going into the FOMC. It is context, not a trading signal.
Calendar: the week ahead
Economic data & Fed
| Date | Time (ET) | Event | Note |
|---|---|---|---|
| Wed Oct 28 | 8:30 | Advance goods trade balance (Sep) | |
| Wed Oct 28 | 14:00 | FOMC decision, press conference after | Hold expected; Oct 28 expiry 14.5% ATM vs VIX1D 12.5 |
| Thu Oct 29 | 8:30 | Q3 GDP (advance), Sep personal income/spending and PCE inflation, jobless claims | Oct 29 expiry 15.8% ATM |
| Thu Oct 29 | – | ECB decision | |
| Thu Oct 29 | 13:00 | 7-year Treasury note auction ($44B) | |
| Fri Oct 30 | 8:30 | Employment cost index (Q3) | Oct 30 expiry 15.9% ATM |
| Fri Oct 30 | 9:45 | Chicago PMI (Oct) | |
| Mon Nov 2 | 10:00 (expected) | ISM manufacturing (Oct) | |
| Tue Nov 3 | 10:00 | JOLTS job openings (Sep) | |
| Fri Nov 6 | 8:30 | October jobs report | Nov 6 expiry 14.2% ATM vs 13.9% Nov 5 |
Earnings
| Date | Timing | Companies | Note |
|---|---|---|---|
| Wed Oct 28 | Before open | Boston Scientific, Garmin, Otis, Etsy | |
| Wed Oct 28 | After close | Microsoft, Alphabet, ServiceNow, KLA, T-Mobile, Ford | Reaction in the Oct 29 expiry (15.8% ATM) |
| Thu Oct 29 | Before open | Eli Lilly, Caterpillar, Mastercard, Merck | |
| Thu Oct 29 | After close | Amazon, Intel, Starbucks, Strategy | Reaction in the Oct 30 expiry (15.9% ATM) |
| Fri Oct 30 | Before open | Exxon Mobil, Chevron, AbbVie | |
| Mon Nov 2 | After close | Apple | Reaction in the Nov 3 expiry (12.9% ATM) |
Volatility dates (expirations, events)
| Date | Event | Note |
|---|---|---|
| Fri Oct 30 | Month-end SPX expiry | Highest ATM IV on the curve (15.9%) |
| Sun Nov 1 | US daylight saving time ends | US data and the open move one hour later in Asia/Europe time |
| Tue Nov 3 | US midterm elections | Nov 4 expiry (first after the vote) 13.9% ATM vs 12.9% Nov 3 |
| Wed Nov 18 | VIX November futures and options expiration | Nov future 18.95, 8% over spot |
| Fri Nov 20 | SPX November monthly expiration | Removing everything through it lifts gamma at spot to about +$25B |
What I'm watching on Wednesday
- 7,700. The all-expiry flip and the weekly and monthly put wall all sit at the same strike. Above it, dealer hedging dampens moves; a close back below it puts the book short gamma again.
- 7,722–7,733. The weekly flip (at the close) and the monthly flip. The near-term windows turn long gamma only above this band.
- 7,800, then 7,600. The weekly call wall and the first large positive strikes above (7,800–7,820), against the largest negative strike below (7,600, −$6.2B) and a profile that falls to about −$110B near 7,270.
- The event premium vs VIX1D. Oct 28–30 expiries at 14.5–15.8–15.9% ATM vs 12.7–12.9% for Nov 2–3, with VIX1D at 12.5. Watch whether the FOMC and megacap reports deliver enough movement to justify it.
- Futures vs spot, and rates vol. November VIX futures sit 8% over spot with VVIX under 100. In Vol Sentiment, US rates, investment grade and high yield (scores 11–15) remain the stressed corner going into the Fed.
Sources
- TheStreet: Stock Market Today (Oct. 27, 2026): Big Tech buoys S&P 500, Nasdaq as growth rebound continues
- Yahoo Finance: Dow, S&P 500, Nasdaq rise as tech gains for second day, chip stocks rally
- Motley Fool: Stock Market Midday, Oct. 27: Tech stocks drive momentum and SoFi surges
- Bloomberg: US consumer confidence rises for first time in four months
- Investing.com: Visa shares fall as weak 2027 outlook overshadows fourth-quarter earnings beat
- eOption: Weekly Event Calendar, Oct 26–30, 2026
- SimianX: Magnificent 7 earnings dates 2026 (Q3 schedule)
- iClarified: Apple to announce Q4 FY26 earnings on November 2
- FedRateCalc: US economic calendar, November 2026 (BLS release dates)
Volatility data: ilovevol.app, from Cboe delayed quotes. GEX assumes dealers are long calls and short puts. VIX futures use settlement prices. Vol Sentiment: ilovevol.app cross-asset score (0 = stress, 100 = calm), one-year window unless noted.
This review is for informational and educational purposes only and is not investment advice. See the disclaimer.
The Daily Vol sends this review to your inbox each trading day: dealer gamma levels, the VIX curves, the SPX vol surface and the levels to watch. Free, one click to unsubscribe.