Home › Blog › Daily Market Review
Daily Market Review · US close
SPX slips under its gamma flip as dealer GEX swings to −$31.2B
SPX fell 0.3% to 7,720, 3 points under its 7,723 flip, and net GEX swung from +$18.7B to −$31.2B. VIX rose 0.29 to 17.20 while November VIX futures fell, and Friday's SPX expiry carries 15.3% ATM vol after Amazon and Intel dropped after hours. Here are the levels for Friday.
- Alphabet's worst day since its 2004 IPO (−12.6%) dragged tech: NDX −1.4%, Russell 2000 +1.0%, SPX −0.3% to 7,720. Q3 GDP grew 3.4% and PCE inflation rose to 3.6%. After hours, Amazon fell about 7% and Intel about 17%.
- A 24-point dip was enough to flip the dealer book: net GEX swung from +$18.7B to −$31.2B and SPX closed 3 points under its 7,723 flip. It is now below the weekly (7,729) and monthly (7,744) flips too.
- VIX rose only 0.29 to 17.20 and the November VIX future fell 0.45 to 18.15, so futures now sit just 5.5% over spot (10% on Wednesday). Friday's SPX expiry prices 15.3% ATM, the highest on the curve, vs 10.5% for Monday.
Scoreboard
| Close | Chg | Prev | |
|---|---|---|---|
| SPX | 7,720 | −0.30% | 7,744 |
| NDX | 29,403 | −1.38% | 29,813 |
| VIX | 17.20 | +0.29 | 16.91 |
| VIX1D | 13.62 | +0.47 | 13.15 |
| VVIX | 98.0 | +1.4 | 96.6 |
| VX Nov / Dec | 18.15 / 18.39 | +1.34% M1→M2 | +0.95% |
| VIX / VIX3M | 0.888 | +0.008 | 0.880 |
| 30D ATM IV / skew | 13.2% / 11.6 | 0.0 / +1.1 | 13.2% / 10.5 |
| Window | Net GEX | Chg | Prev | Flip | Call wall | Put wall | |
|---|---|---|---|---|---|---|---|
| SPX | All | −$31.2B | −$49.9B | +$18.7B | 7,723 | 8,000 | 7,000 |
| SPX | Weekly | −$30.2B | −$29.8B | −$0.4B | 7,729 | 7,750 | 7,700 |
| SPX | Monthly | −$48.3B | −$40.3B | −$8.0B | 7,744 | 8,000 | 7,700 |
| NDX | All | +$0.34B | −$0.95B | +$1.29B | 29,374 | 29,675 | 29,000 |
| NDX | Weekly | +$0.64B | −$0.37B | +$1.01B | 29,307 | 29,600 | 29,000 |
| NDX | Monthly | +$1.15B | −$0.61B | +$1.76B | 29,246 | 29,675 | 27,500 |
Dealer gamma by expiry window. All = every listed expiry; Weekly = contracts expiring within 7 calendar days; Monthly = within 30 days. Net GEX in $ per 1% move.
1. The tape: Alphabet's worst day since its IPO, and a rotation underneath
Alphabet fell 12.6% after its third-quarter results, the stock's worst session since it listed in 2004 and roughly $500 billion of market value gone. Cloud revenue more than doubled, but negative free cash flow revived the question of when AI spending pays back. Software followed: ServiceNow lost about 25% on weak fourth-quarter guidance, Fortinet about 20% after cutting its service revenue outlook, and the IGV software ETF about 4%. Microsoft beat, with Azure up 48%, and finished roughly flat.
The index damage was concentrated. The S&P 500 slipped 0.3% to 7,720, ending a three-day winning streak, the Dow lost 0.25% to 52,343 and the Nasdaq Composite fell 1.4% to 26,185. The Russell 2000 rose 1.0% to 2,859, and money moved into health care, financials and real estate. Eli Lilly gained about 6% after raising its outlook, helping the S&P 500 health care sector to a record. ADT jumped about 34% on a cash buyout and DoorDash rose about 5% on its $17 billion deal for Instacart, while Marvell fell more than 10% on a report that it is in talks to buy Lumentum.
The data ran hot. Q3 GDP grew at a 3.4% annualized rate, above the 3.1% consensus, and headline PCE inflation rose to 3.6% year over year from 3.4%. Core PCE was 3.1%, with a 0.3% monthly gain in line with forecasts. The 10-year Treasury yield still eased about 6 basis points to near 4.99%, WTI crude slipped toward $102 and Brent settled near $115. The ECB held its deposit rate at 2.5%, and Christine Lagarde said she will leave the presidency early. After the bell, Amazon fell as much as 10% before trimming the loss to about 7%: it kept its $220 billion capex plan and trailing free cash flow turned negative. Intel dropped about 17% on a fourth-quarter revenue forecast below estimates.
Why it matters for vol: Thursday's expiry priced 15.1% ATM vol, about a 74-point move, and SPX moved 24 points. A 12.6% drop in one of the largest index weights was absorbed by a rotation into small caps and defensives. That pattern is high dispersion, low index vol. The event premium has rolled to Friday, which now carries both the Amazon and Intel reactions.
2. Dealer gamma: a small move, a big swing
Net GEX across all expiries went from +$18.7B to −$31.2B per 1% move, a $49.9B swing on a 0.3% decline. The flip is 7,723 (7,704 on Wednesday) and SPX closed at 7,720, 3 points (0.04%) under it, after sitting 40 points above it a day earlier. The close is effectively on the line, so the sign of the book can change with a few points either way.
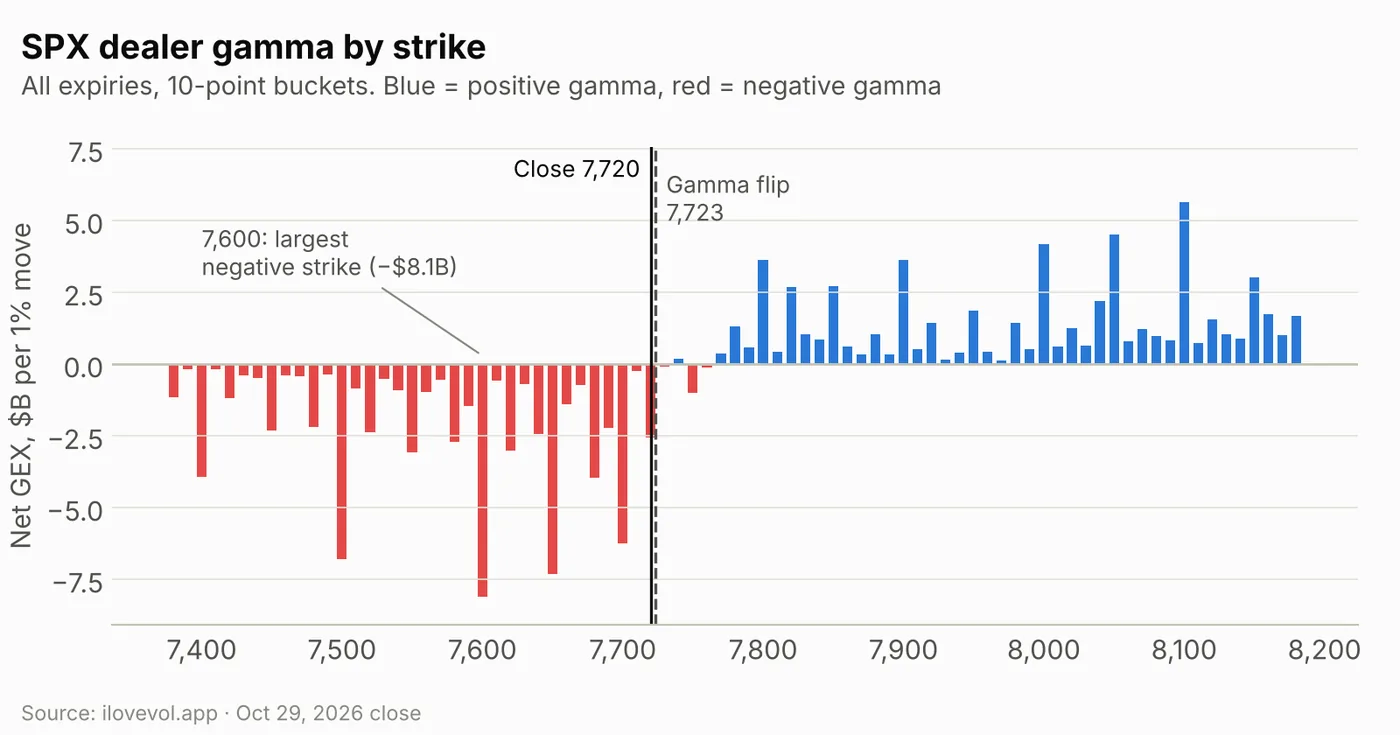
The strike map explains the swing. Every bucket from 7,400 to 7,730 is negative, 7,750 adds another −$1.0B just above spot, and the big negative strikes got deeper: 7,600 (−$8.1B), 7,650 (−$7.3B), 7,500 (−$6.8B) and 7,700 (−$6.2B). The first positive bucket over spot is 7,740. The largest positive strikes are farther away, at 8,100 (+$5.7B), 8,050 (+$4.5B) and 8,000 (+$4.2B), with 7,800 and 7,900 at +$3.6B each.
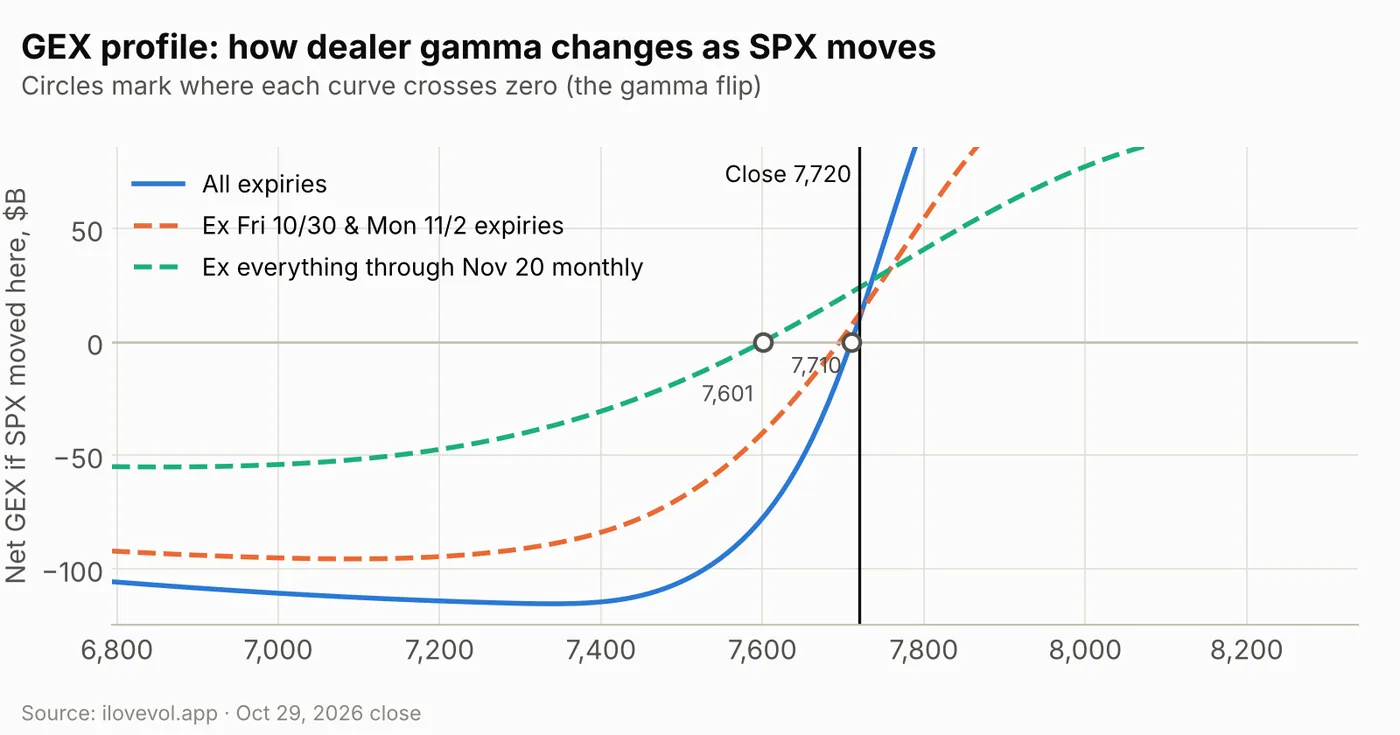
The modeled profile crosses zero near 7,710, within a few points of the site's 7,723 flip, and it is close to vertical there: gamma goes from about −$80B at 7,600 to strongly positive by 7,780. That steepness is why a 24-point drop could turn a long book into a short one.
Friday and Monday don't change the picture much. Remove the Oct 30 and Nov 2 expiries and the curve keeps the same shape, with a flip near 7,696.
Past the November monthly, dealers are long. Strip out everything through Nov 20 and modeled gamma at spot is about +$24B, with a flip near 7,601. The downside is still deep: the all-expiry curve bottoms near −$115B around 7,334.
Weekly vs monthly: below every flip
Splitting gamma by expiry window (net GEX, flip and walls for each window are in the dealer-gamma table under the scoreboard) shows the reverse of Wednesday: the close now sits under the flip in all three windows, and the near-term windows carry the short gamma. Weekly = contracts expiring within 7 calendar days; Monthly = within 30 days.
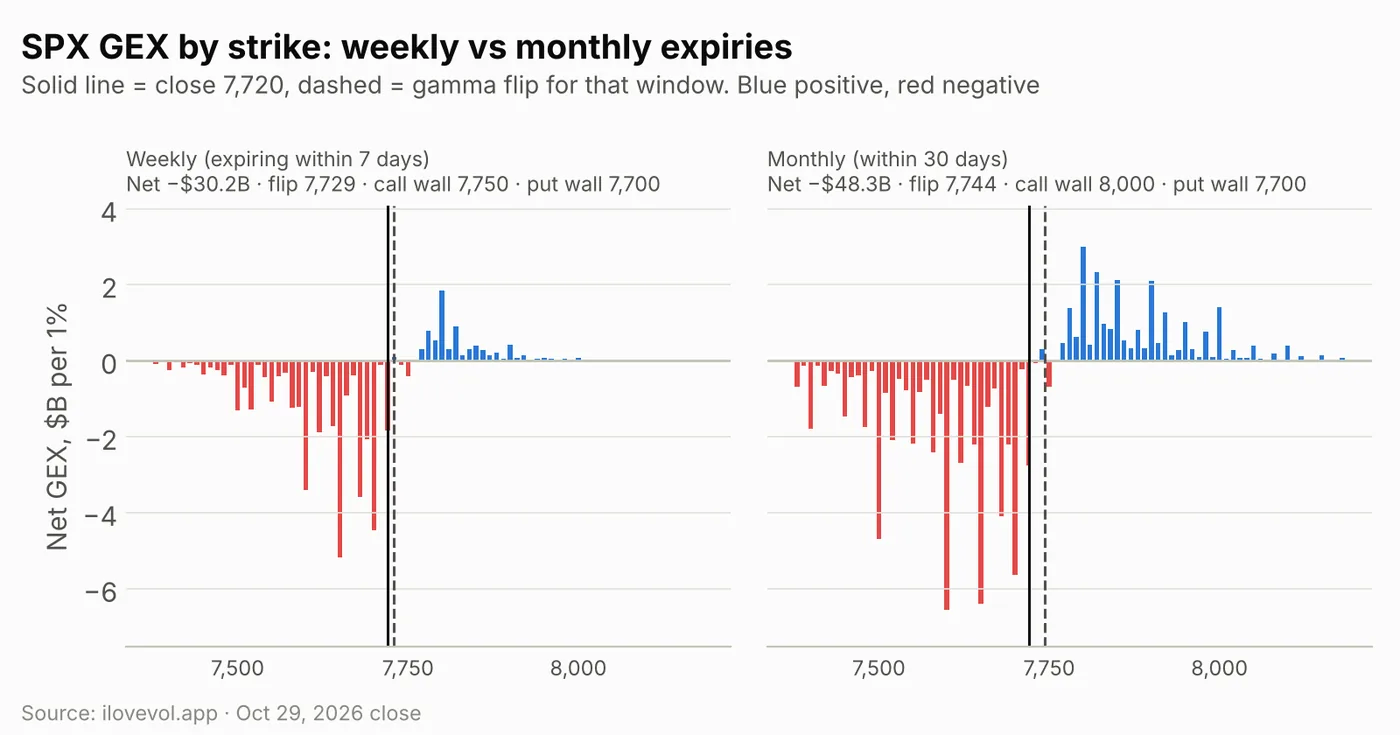
SPX weekly: the next 7 days carry −$30.2B, from −$0.4B on Wednesday, almost all of the all-expiry total. The window holds five expiries, Oct 30 to Nov 5, covering the Amazon and Intel reactions, Apple, the midterm vote and AMD. Its flip is 7,729, 9 points above the close, with the call wall at 7,750 and the put wall at 7,700, a 50-point band around spot. The largest weekly buckets are 7,650 (−$5.2B) and 7,700 (−$4.5B) on the put side and 7,800 (+$1.8B) on the call side.
SPX monthly: the 30-day window is −$48.3B (−$8.0B on Wednesday). Its flip is 7,744, 24 points above the close, with the put wall at 7,700 and the call wall at 8,000. Expiries 8–30 days out add about −$18B on top of the weekly book, while expiries beyond 30 days are net long about $17B, which offsets roughly a third of the near-term short gamma.
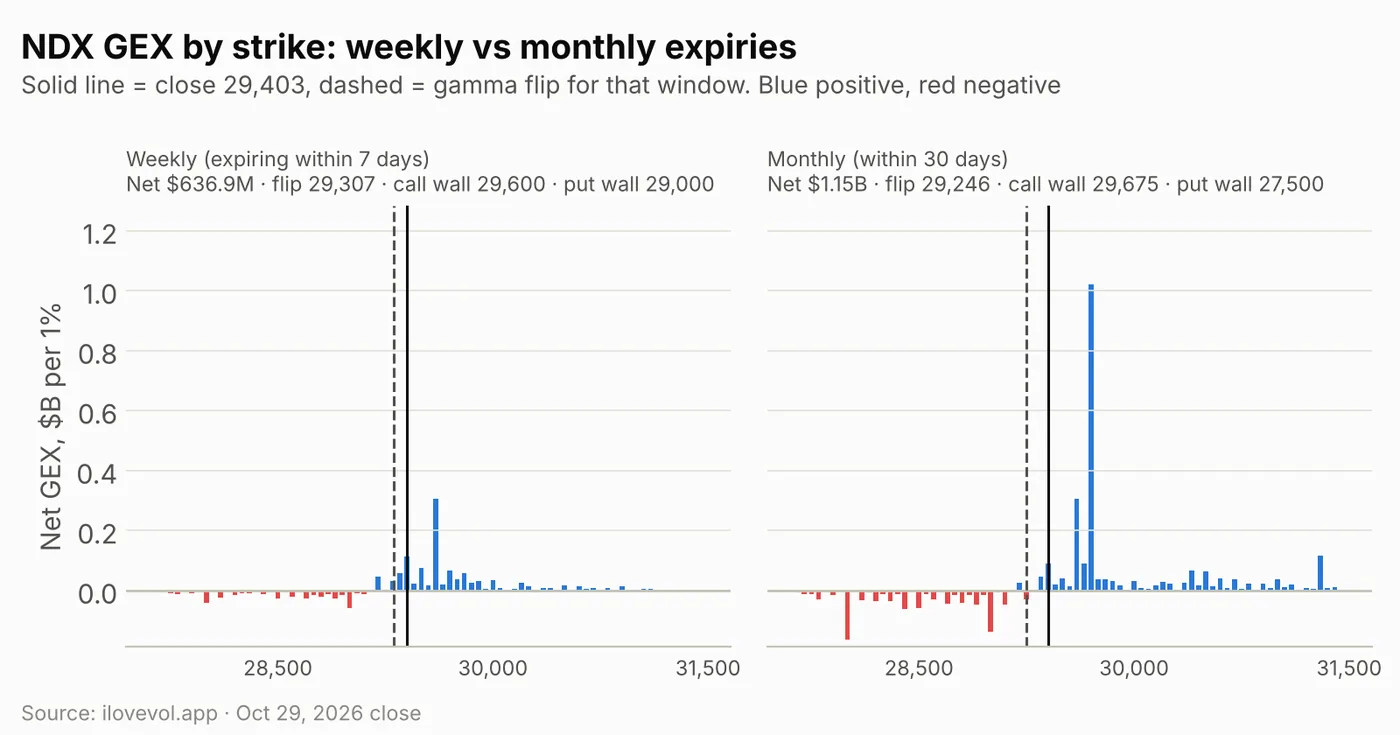
NDX fell 1.38% to 29,403 and most of its long gamma went with it: +$0.34B in total (from +$1.29B). It closed only 29 points (0.1%) above its 29,374 flip. Both near-term windows are still positive: weekly +$0.64B (flip 29,307, call wall 29,600, put wall 29,000) and monthly +$1.15B (flip 29,246, call wall 29,675). The single largest monthly bucket, around 29,700, now sits about 300 points over the close. Expiries beyond 30 days are net short about $0.81B.
RUT rose 1.0% to 2,859 and its long gamma grew to +$0.84B (from +$0.20B). It closed 21 points above its 2,838 flip, right at its 2,860 call wall, with the put wall at 2,800.
3. The VIX complex: spot up, futures down
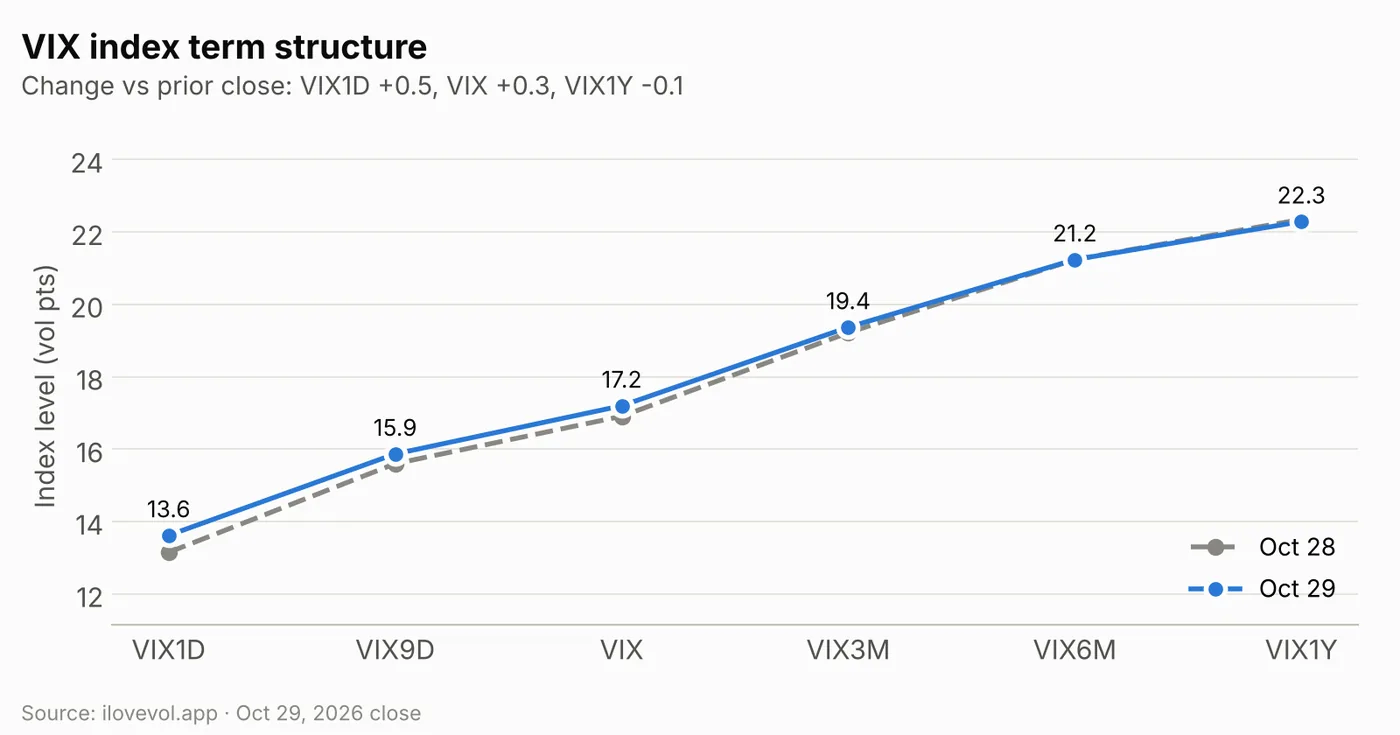
The index curve moved up a little at the front and not at all at the back. VIX1D rose 0.47 to 13.62 as its window rolled to Friday's Amazon and Intel reactions, VIX9D gained 0.27 to 15.87 and VIX 0.29 to 17.20. VIX3M added 0.15, VIX6M was unchanged at 21.24 and VIX1Y slipped 0.06. The curve still slopes upward from VIX1D to VIX1Y with no kink.
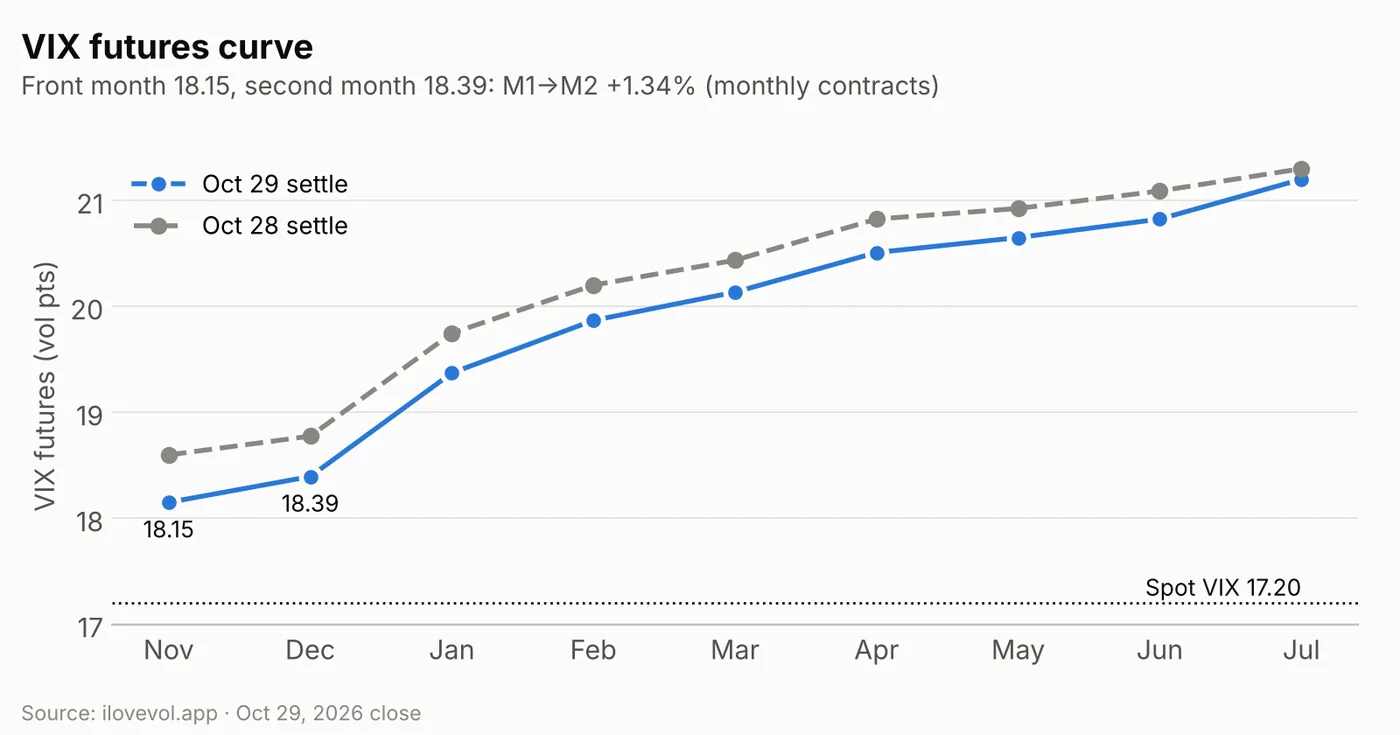
Futures went the other way. November settled at 18.15, down 0.45, and December at 18.39, down 0.38; the whole curve shifted lower through July. M1→M2 steepened to +1.34% from +0.95%. With spot up and futures down, November's premium over spot VIX shrank to about 5.5% from 10% on Wednesday. VVIX rose 1.4 to 98.0.
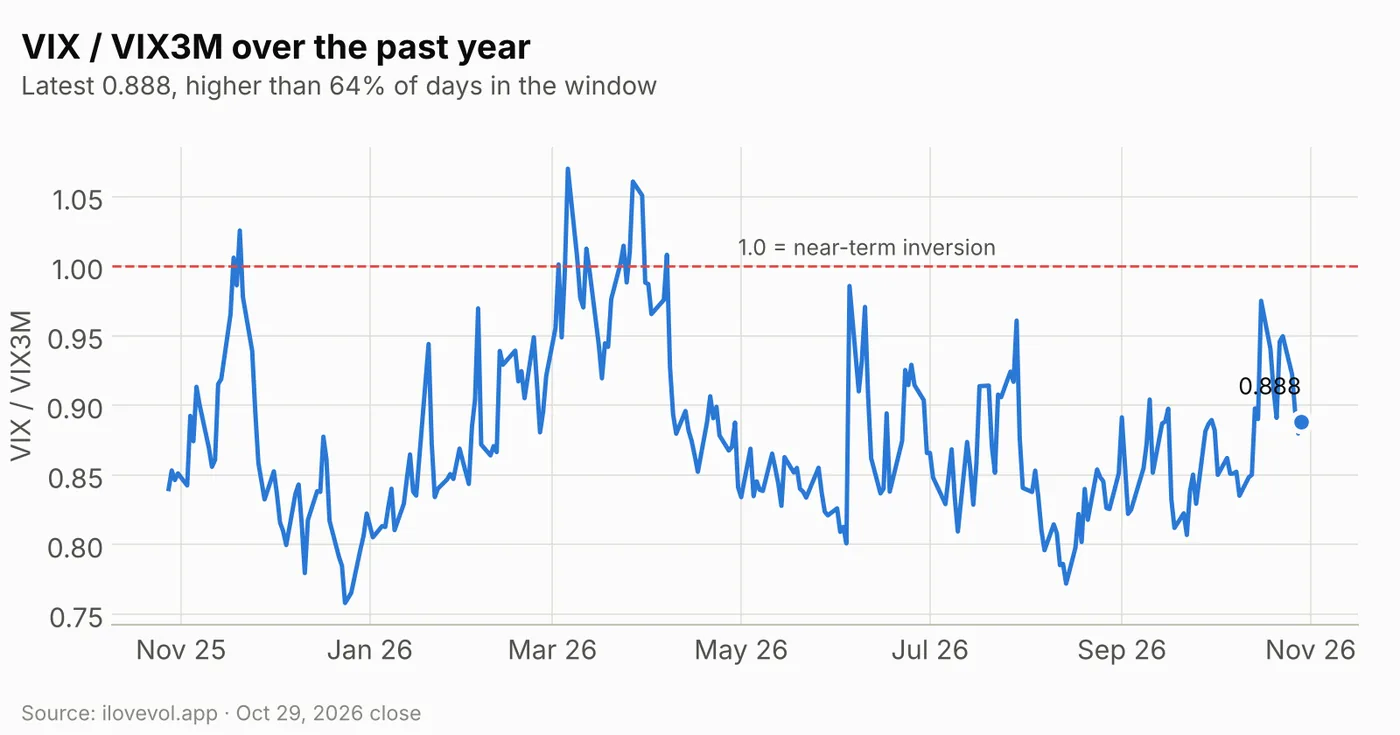
VIX/VIX3M ticked up to 0.888 from 0.880, higher than 64% of the past year's sessions (61% on Wednesday).
4. Implied vs realized: still nearly twice realized
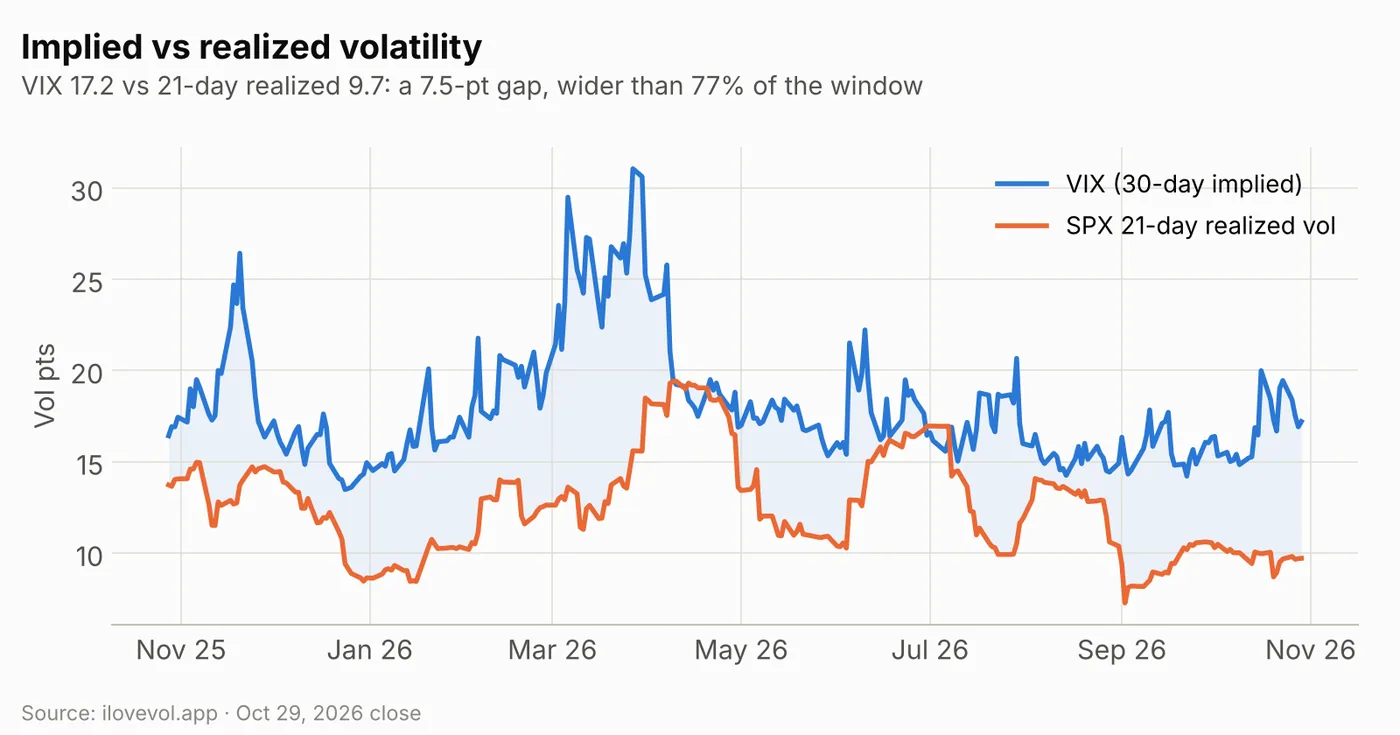
SPX 21-day realized vol is 9.7. With VIX at 17.2, the gap is 7.5 points, up from 7.2 on Wednesday and wider than 77% of the past year (75% on Wednesday). Index-level realized vol stayed near 10 even on a day when a top index weight fell 12.6%, because the rest of the market moved the other way.
5. The SPX surface: skew steepens, Friday stands out
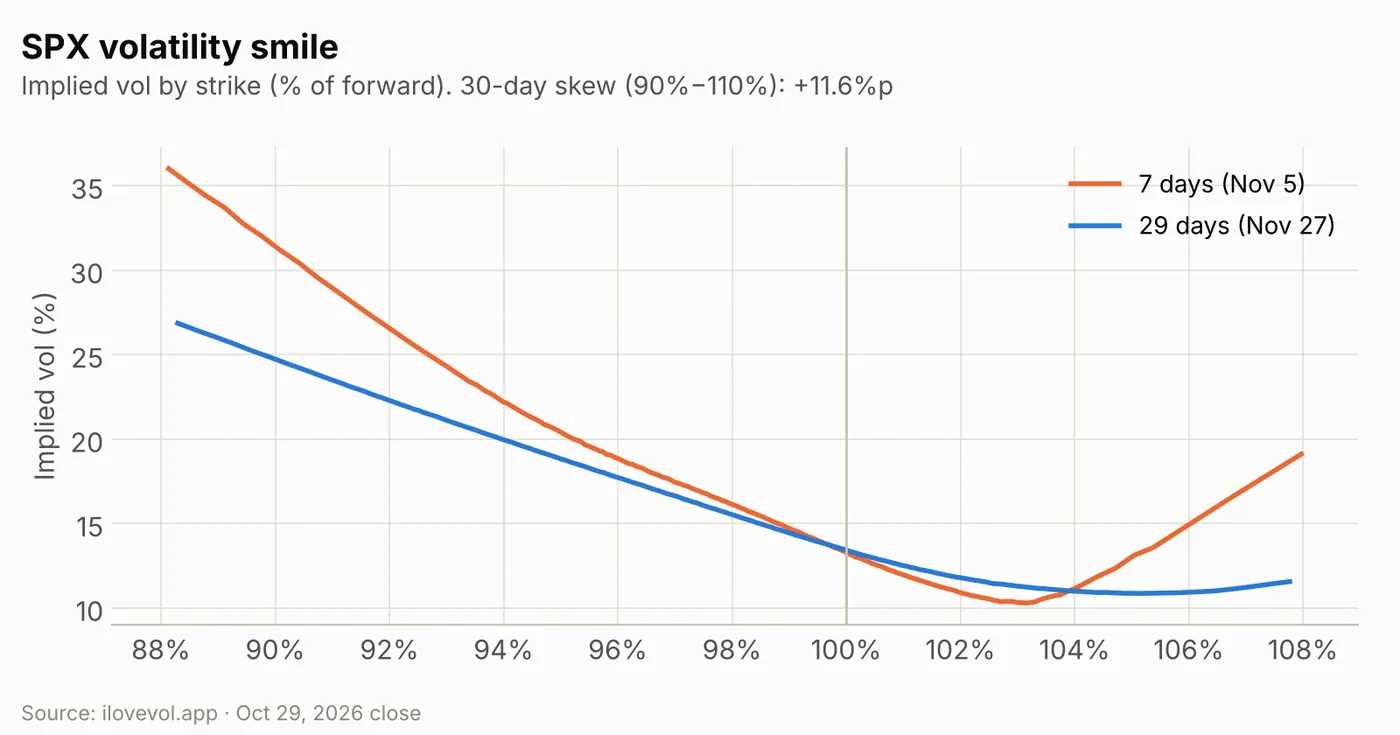
Thirty-day ATM IV held at 13.2%, but 30-day skew (90% vs 110%) steepened to 11.6 points from 10.5. The 7-day smile (Nov 5) has 88% puts near 36% vol and a call wing that turns up from about 103%. The 29-day curve (Nov 27) is about 27% at 88% and nearly flat on the call side.
The expiry table shows where the event premium sits. ATM IV is 15.3% for Friday Oct 30 (Amazon and Intel reactions, the employment cost index and month-end), about a 0.96% or 74-point one-day move. It drops to 10.5% for Monday Nov 2, then 11.5% for Nov 3 (after Apple reports Monday evening), 12.9% for Nov 4 (after the midterm vote and AMD), 13.1% for Nov 5 and 13.7% for Nov 6, the day of the October jobs report.
6. Cross-asset Vol Sentiment: calmer overall, US equities less so
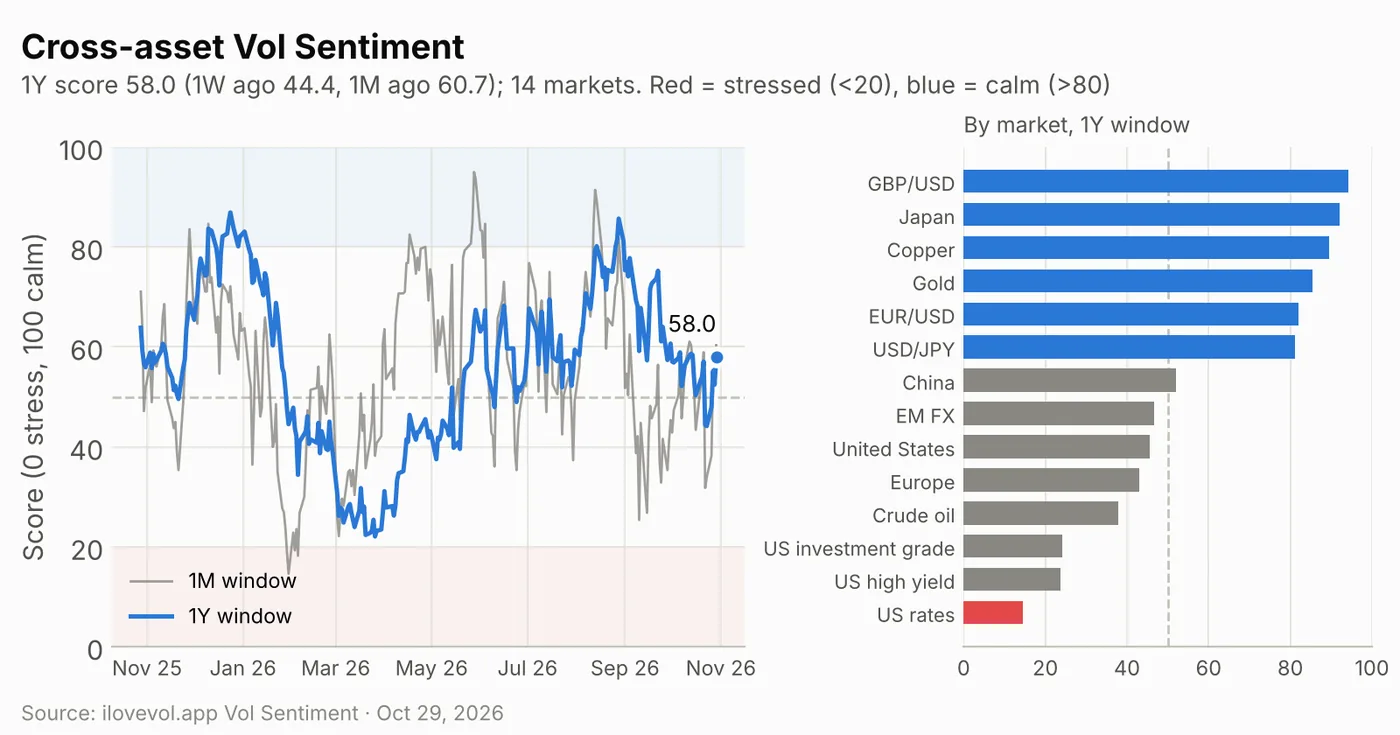
The cross-asset Vol Sentiment score places volatility in 14 equity, currency, rates, credit and commodity markets within its own one-year range (0 = stress, 100 = calm). On the one-year window it is 58.0, on the calm side of 50 and up from 53.4 on Wednesday and 44.4 a week ago, close to 60.7 a month ago. It is higher than 54% of the past year's sessions. The one-month window is 60.4 and the three-month window 44.2.
US rates (14.6) remain the only market in the stressed zone; investment grade (24.2) and high yield (23.8) sit just above it. US equities slipped to 45.6 from 50.4, close to Europe (42.9). The calmest are GBP/USD (94.2), Japan (92.1), copper (89.6) and gold (85.4). Next to the SPX picture, the overall score improved even as US equity vol firmed: the stress is specific to US tech and rates, not broad across assets. It is context, not a trading signal.
Calendar: the week ahead
Economic data & Fed
| Date | Time (ET) | Event | Note |
|---|---|---|---|
| Fri Oct 30 | 8:30 | Employment cost index (Q3) | Oct 30 expiry 15.3% ATM, the highest on the curve |
| Fri Oct 30 | 9:45 | Chicago PMI (Oct) | |
| Mon Nov 2 | 10:00 (expected) | ISM manufacturing (Oct) | Nov 2 expiry 10.5% ATM |
| Tue Nov 3 | 10:00 | JOLTS job openings (Sep) | |
| Wed Nov 4 | 10:00 (expected) | ISM services (Oct) | Nov 4 expiry 12.9% ATM |
| Thu Nov 5 | 8:30 | Weekly jobless claims | |
| Fri Nov 6 | 8:30 | October jobs report | Nov 6 expiry 13.7% ATM vs 13.1% Nov 5 |
| Wed Nov 18 | 14:00 | FOMC minutes (Oct 27–28 meeting) |
Earnings
| Date | Timing | Companies | Note |
|---|---|---|---|
| Fri Oct 30 | Before open | Exxon Mobil, Chevron, AbbVie | Amazon and Intel reactions also land in the Oct 30 expiry |
| Mon Nov 2 | Before open | Progressive, Marriott | |
| Mon Nov 2 | After close | Apple | Reaction in the Nov 3 expiry (11.5% ATM vs 10.5% Nov 2) |
| Mon Nov 2 | – | Palantir, Vertex Pharmaceuticals | Timing not confirmed |
| Tue Nov 3 | Before open | Shopify, Eaton, Apollo, Marathon Petroleum | |
| Tue Nov 3 | After close | AMD, Arista Networks, Amgen, Booking | Reaction in the Nov 4 expiry (12.9% ATM) |
| Wed Nov 4 | Before open | Uber, McDonald's, CVS Health | |
| Wed Nov 4 | After close | Qualcomm, AppLovin, MercadoLibre, DoorDash | |
| Thu Nov 5 | Before open | ConocoPhillips, Duke Energy, Cigna | |
| Thu Nov 5 | After close | Airbnb, Cloudflare, Monster Beverage |
Volatility dates (expirations, events)
| Date | Event | Note |
|---|---|---|
| Fri Oct 30 | Month-end SPX expiry | Highest ATM IV on the curve (15.3%) |
| Sun Nov 1 | US daylight saving time ends | US data and the open move one hour later in Asia/Europe time |
| Tue Nov 3 | US midterm elections | Nov 4 expiry (first after the vote) 12.9% ATM vs 11.5% Nov 3 |
| Wed Nov 18 | VIX November futures and options expiration | Nov future 18.15, about 5.5% over spot |
| Fri Nov 20 | SPX November monthly expiration | Removing everything through it leaves modeled gamma at spot about +$24B |
What I'm watching on Friday
- 7,723–7,744. The all-expiry flip (7,723), the weekly flip (7,729), the weekly call wall (7,750) and the monthly flip (7,744). A close back above this band would put dealers long gamma in every window again.
- 7,700, then 7,650 and 7,600. The weekly and monthly put wall, then the two largest negative strikes (−$7.3B and −$8.1B). Below 7,600 the profile shows little dealer support, bottoming near −$115B around 7,334.
- Friday's 15.3% vs the after-hours moves. Amazon down about 7% and Intel about 17% after the close, plus the employment cost index at 8:30. The expiry implies about a 74-point move; Thursday's 15.1% was met with a 24-point move.
- Futures vs spot. The November VIX future is only 5.5% over spot (10% on Wednesday) and VVIX is 98.0. Spot rising while futures fall is a narrowing cushion worth tracking into Monday's low-vol 10.5% expiry.
- NDX at its flip. NDX closed 29 points above 29,374 with only +$0.34B of gamma left and a 29,000 put wall in both near-term windows.
Sources
- Yahoo Finance: Dow, S&P 500, Nasdaq slip as Alphabet stock sinks 12% and AI jitters return
- StockTitan: Stock Market Today October 29, 2026: Nasdaq falls as Alphabet drops; Amazon and Intel slide after hours
- TheStreet: Stock Market Today (Oct. 29, 2026): S&P 500 falls after Alphabet and Microsoft issue divergent earnings
- Euronews: ECB holds rates at 2.5% as Lagarde announces early exit
- Stockti: Earnings calendar, Nov 2–6, 2026
- FedRateCalc: US economic calendar, November 2026 (BLS release dates)
Volatility data: ilovevol.app. GEX assumes dealers are long calls and short puts. VIX futures use settlement prices. Vol Sentiment: ilovevol.app cross-asset score (0 = stress, 100 = calm), one-year window unless noted.
This review is for informational and educational purposes only and is not investment advice. See the disclaimer.
The Daily Vol sends this review to your inbox each trading day: dealer gamma levels, the VIX curves, the SPX vol surface and the levels to watch. Free, one click to unsubscribe.