Home › Blog › Daily Market Review
Daily Market Review · US close
Chip selloff sinks NDX 1.2% and deepens SPX dealer short gamma to −$54.2B
SPX fell 0.40% to 7,562, 62 points under its 7,624 flip, and net GEX dropped from −$14.3B to −$54.2B. VIX rose 0.60 to 19.30, VIX1D 2.64 to 18.63, and the first SPX expiry after Nvidia's results now prices 15.2% ATM vol.
- October PPI's 6.5% annual rate, the highest since 2022, lifted December hike odds to about 90%, and the chip selloff spread after Nvidia's CEO exit. SPX −0.40% to 7,562, NDX −1.22%, Dow +0.10%; AMD −8.8%. SPX still gained 2.5% on the week.
- Net GEX fell from −$14.3B to −$54.2B, with SPX 62 points under its 7,624 flip. The weekly window (−$35.0B) now includes the Nov 20 monthly.
- VIX rose 0.60 to 19.30, VIX1D 2.64 to 18.63 and VVIX to 101.5. November VIX futures settled 0.19 under spot, and the post-Nvidia Nov 18 expiry rose to 15.2% ATM.
Scoreboard
| Close | Chg | Prev | |
|---|---|---|---|
| SPX | 7,562 | −0.40% | 7,592 |
| NDX | 27,944 | −1.22% | 28,289 |
| VIX | 19.30 | +0.60 | 18.70 |
| VIX1D | 18.63 | +2.64 | 15.99 |
| VVIX | 101.5 | +4.8 | 96.7 |
| VX Nov / Dec | 19.11 / 19.44 | +1.73% M1→M2 | +1.22% |
| VIX / VIX3M | 0.936 | +0.004 | 0.932 |
| 30D ATM IV / skew | 14.8% / 12.3 | +0.5 / +0.4 | 14.3% / 11.9 |
| Window | Net GEX | Chg | Prev | Flip | Call wall | Put wall | |
|---|---|---|---|---|---|---|---|
| SPX | All | −$54.2B | −$39.9B | −$14.3B | 7,624 | 8,000 | 7,000 |
| SPX | Weekly | −$35.0B | −$34.2B | −$0.8B | 7,631 | 7,600 | 7,500 |
| SPX | Monthly | −$46.3B | −$26.6B | −$19.7B | 7,635 | 7,700 | 7,500 |
| NDX | All | −$1.55B | −$1.16B | −$0.39B | 28,344 | 29,000 | 27,000 |
| NDX | Weekly | −$0.43B | −$0.70B | +$0.27B | 28,138 | 29,675 | 27,500 |
| NDX | Monthly | −$0.87B | −$0.85B | −$0.02B | 28,275 | 29,675 | 27,000 |
Dealer gamma by expiry window. All = every listed expiry; Weekly = contracts expiring within 7 calendar days; Monthly = within 30 days. Net GEX in $ per 1% move.
1. The tape: chips keep sliding, PPI keeps the Fed on hike watch
The S&P 500 fell 31 points (0.40%) to 7,562, its second straight decline, while the Dow edged up 0.10% to 52,348. The Nasdaq Composite lost 0.91% to 25,136, the Nasdaq-100 1.22% to 27,944 and the Russell 2000 0.31% to 2,790. It was still a strong week: SPX finished 2.5% above last Friday's close, and the Nasdaq posted its best week since August, according to CNBC via 24/7 Wall St.
Technology was the weakest sector (about −2.0%), while consumer staples (+1.4%), communication services (+1.1%) and energy (+1.0%) led. The selling stayed concentrated in chips a day after Jensen Huang's resignation as Nvidia CEO. Nvidia fell another 2.0% to about $163 after HSBC cut it to Hold and slashed its target to $170 from $365, leaving it about 12% lower on the week and under $4 trillion in market value, Yahoo Finance reported. Thursday's winners reversed: AMD dropped 8.8%, the worst S&P 500 stock, and Broadcom 4.8%, with Intel down 2.5%. Cisco gave up 6.2% despite a beat-and-raise quarter, per Kiplinger.
October producer prices rose 0.3% on the month, slightly below the 0.4% forecast, with core up 0.3% as expected. The year-over-year rates were the problem: 6.5% headline, the highest since November 2022, and 5% core. CME FedWatch odds of a quarter-point hike in December rose to about 90% from 85%. The 10-year Treasury yield touched 5.17%, its highest since October, before settling near 5.15%. WTI was little changed near $89, gold was flat and bitcoin fell about 4% to roughly $68,300. Kiplinger also reported that Anthropic's IPO is expected to price on Wednesday evening and begin trading on Nasdaq on Thursday.
Why it matters for vol: the index move was modest, but it came on the steep part of the gamma curve and in the most crowded part of the market. Friday's PPI expiry priced about 81 points and SPX moved 31, yet front-end vol rose anyway because next week stacks Nvidia, the VIX expiration and the November monthly within three sessions.
2. Dealer gamma: further below the line
Net GEX across all expiries fell to −$54.2B per 1% move from −$14.3B. The flip edged up to 7,624 from 7,616, and SPX closed 62 points (0.8%) below it, against 24 points on Thursday. Most of the change is price: the close moved 30 points further down a curve that was already steep below the flip.
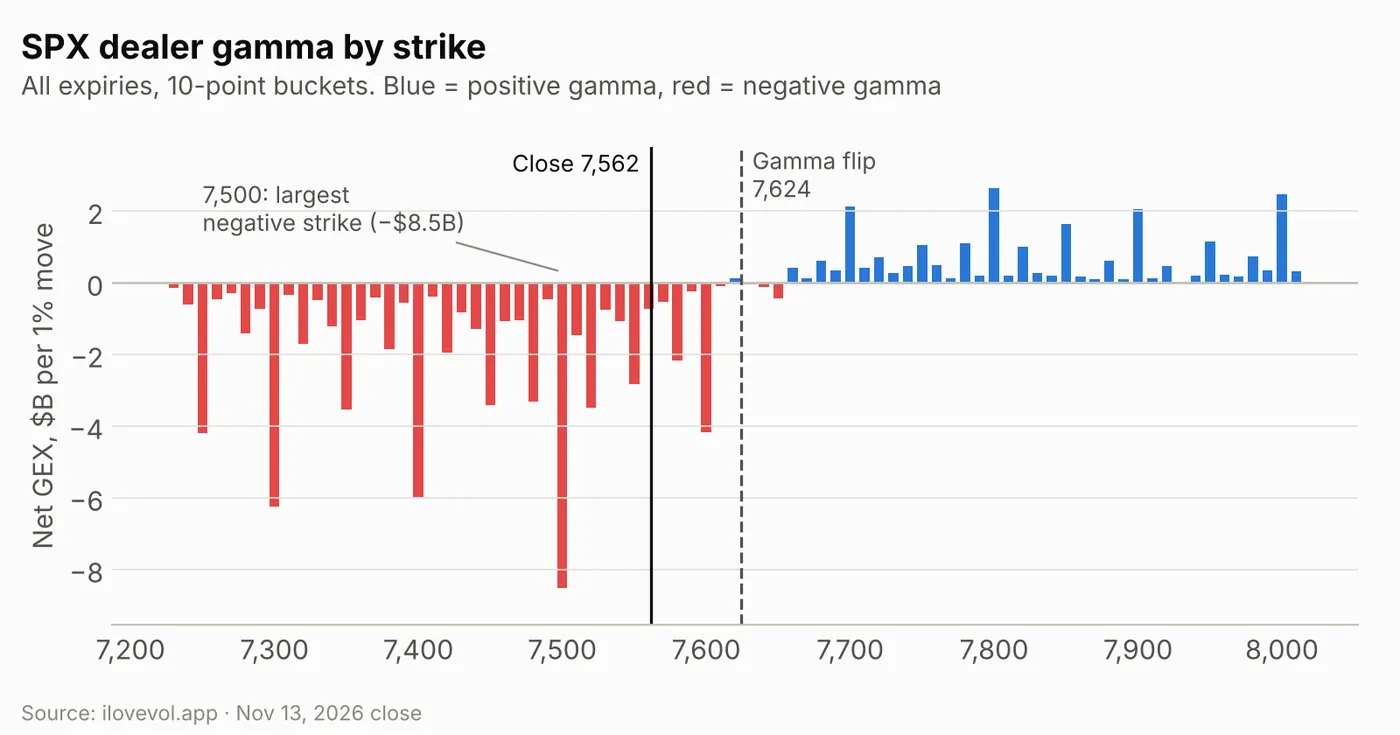
The strike map still splits at about 7,620; the first positive bucket above spot is 7,620. Below it, the largest negative buckets are 7,500 (−$8.5B), 7,300 (−$6.2B), 7,400 (−$6.0B), 7,250 (−$4.2B) and 7,600 (−$4.2B). Above it, the largest positive buckets are 7,800 (+$2.6B), 8,000 (+$2.5B), 7,700 (+$2.1B) and 7,900 (+$2.1B). The negative side is far heavier than the positive side.
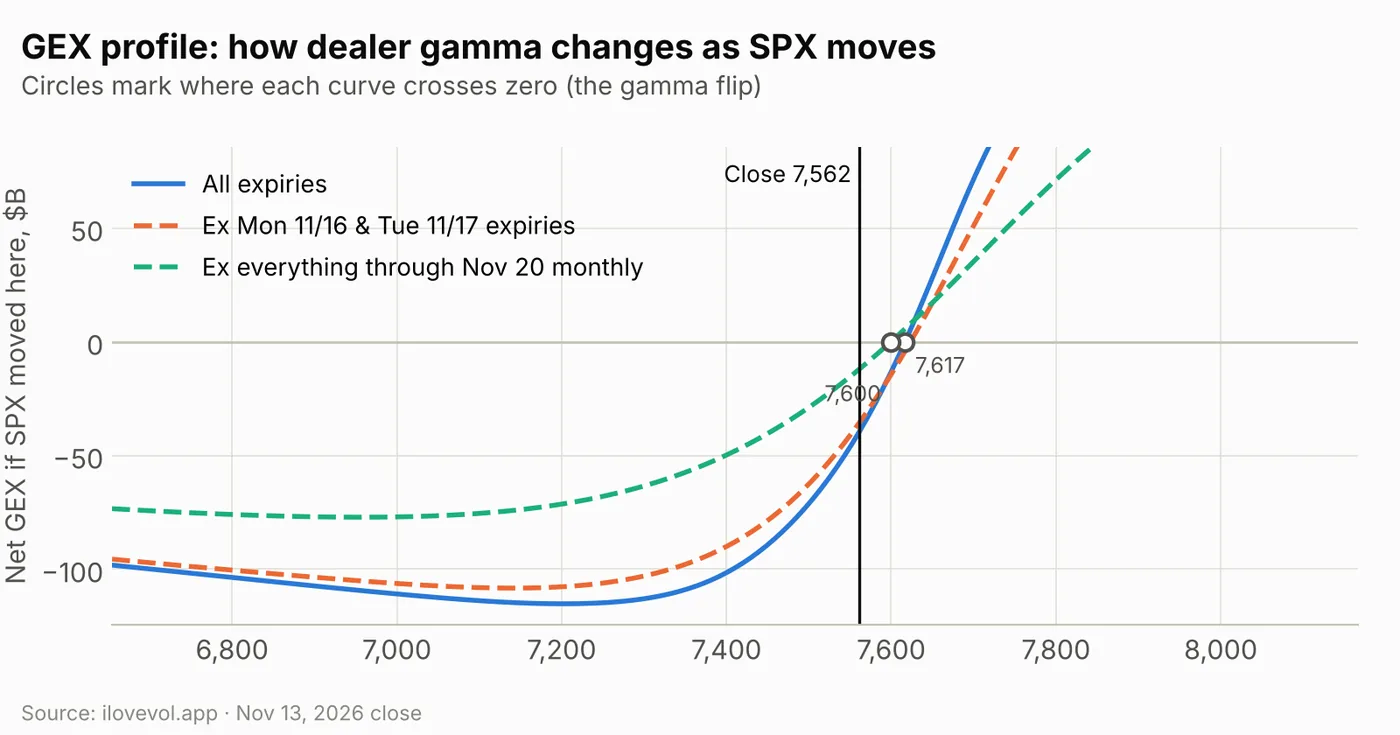
The modeled profile crosses zero near 7,617 and reads about −$39B at the close. It is very steep around spot: about −$13B at 7,600 and +$28B at 7,650 above, against −$46B at 7,550 and −$71B at 7,500 below. The floor is near −$115B around 7,200.
Monday and Tuesday are not the problem. Without the Nov 16 and Nov 17 expiries, modeled gamma at spot is about −$35B, with the flip near 7,623, so those two days add only about −$4B.
The Nov 18–20 expiries carry most of it. Without everything through the Nov 20 monthly, gamma at spot is about −$12B and the flip drops to about 7,600. Roughly two-thirds of the modeled short gamma at spot sits in the three expiries that cover Nvidia's results, the VIX expiration and the monthly.
Weekly vs monthly: the monthly rolls into the weekly window
The three SPX flips now sit in an 11-point band about 62–73 points above the close: all-expiry 7,624, weekly 7,631, monthly 7,635 (numbers in the dealer-gamma table under the scoreboard). The big jump in the weekly window is partly mechanical: on Thursday it covered Nov 13–19, and now it covers Nov 16–20, which includes the November monthly.
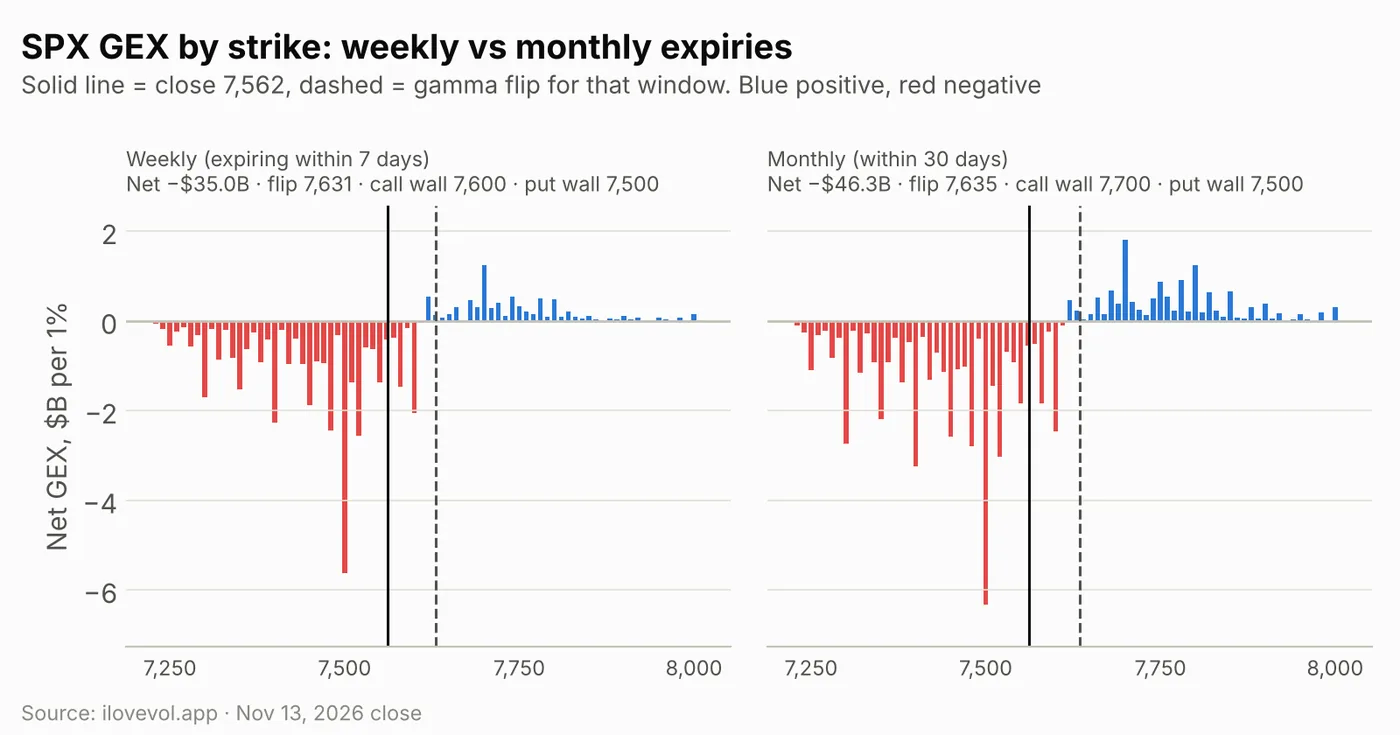
SPX weekly: the next 7 days hold −$35.0B, down from −$0.8B, across five expiries from Nov 16 to Nov 20. That is about 65% of the all-expiry total. The flip is 7,631, the call wall moved down to 7,600 from 7,650, and the put wall is still 7,500. The largest weekly buckets are 7,500 (−$5.6B), 7,520 (−$2.6B) and 7,480 (−$2.5B); the largest positive one is 7,700 (+$1.2B).
SPX monthly: the 30-day window deepened to −$46.3B from −$19.7B, with the flip at 7,635, the call wall at 7,700 and the put wall at 7,500. Its largest buckets are 7,500 (−$6.3B), 7,400 (−$3.2B) and 7,700 (+$1.8B). That leaves about −$11.4B in expiries 8–30 days out. Everything beyond 30 days now nets to about −$7.9B, against +$5.4B on Thursday, so at this price even the longer-dated book no longer offsets the near-term short gamma.
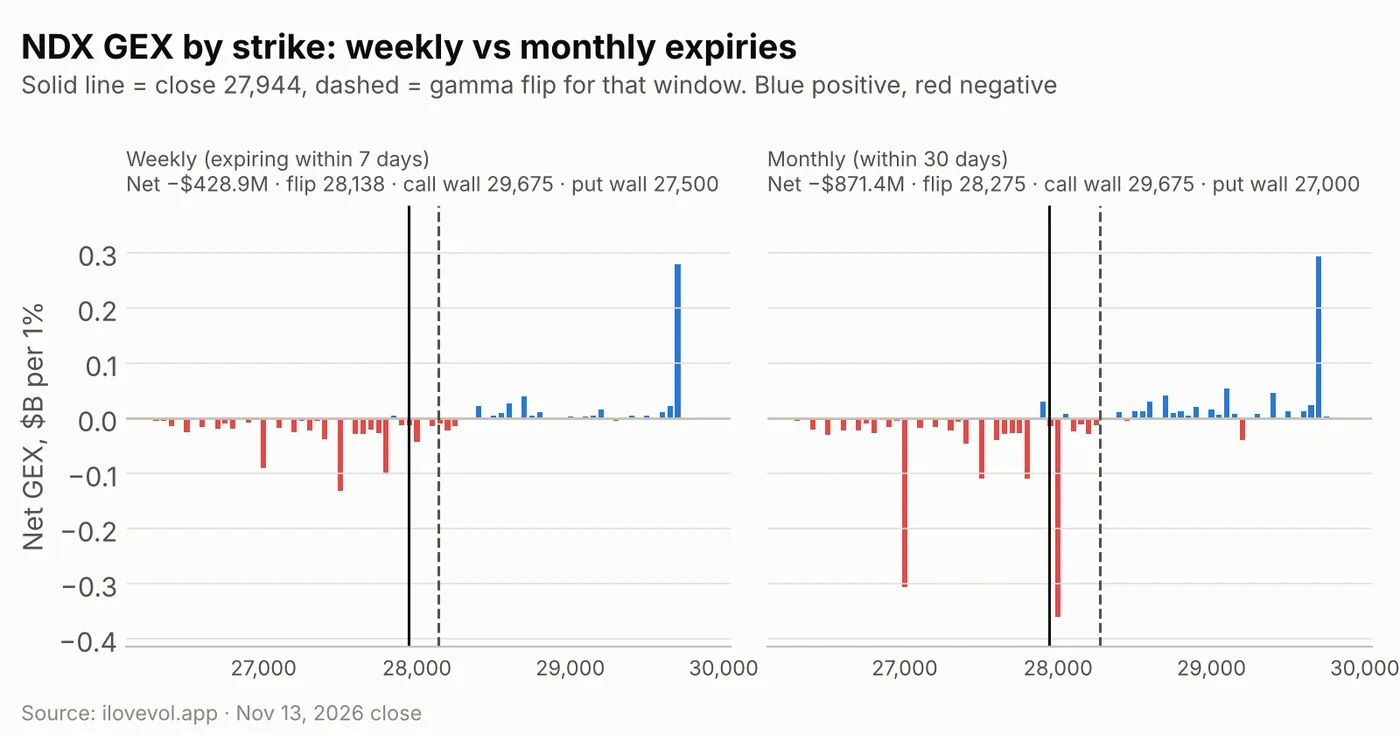
NDX fell 1.22% to 27,944 and its short gamma deepened to −$1.55B from −$0.39B, 400 points under its 28,344 flip. The weekly window turned negative at −$0.43B from +$0.27B (flip 28,138, call wall 29,675, put wall 27,500), so the index is now 194 points below the weekly flip as well. The monthly window is −$0.87B (flip 28,275, call wall 29,675, put wall 27,000); its largest buckets are 28,000 (−$0.36B), 27,000 (−$0.31B) and 29,700 (+$0.29B).
RUT fell 0.31% to 2,790 and its short gamma deepened to −$1.84B from −$1.12B, 53 points under its 2,843 flip, with the call wall at 2,900 and the put wall at 2,750.
3. The VIX complex: a kink at the very front
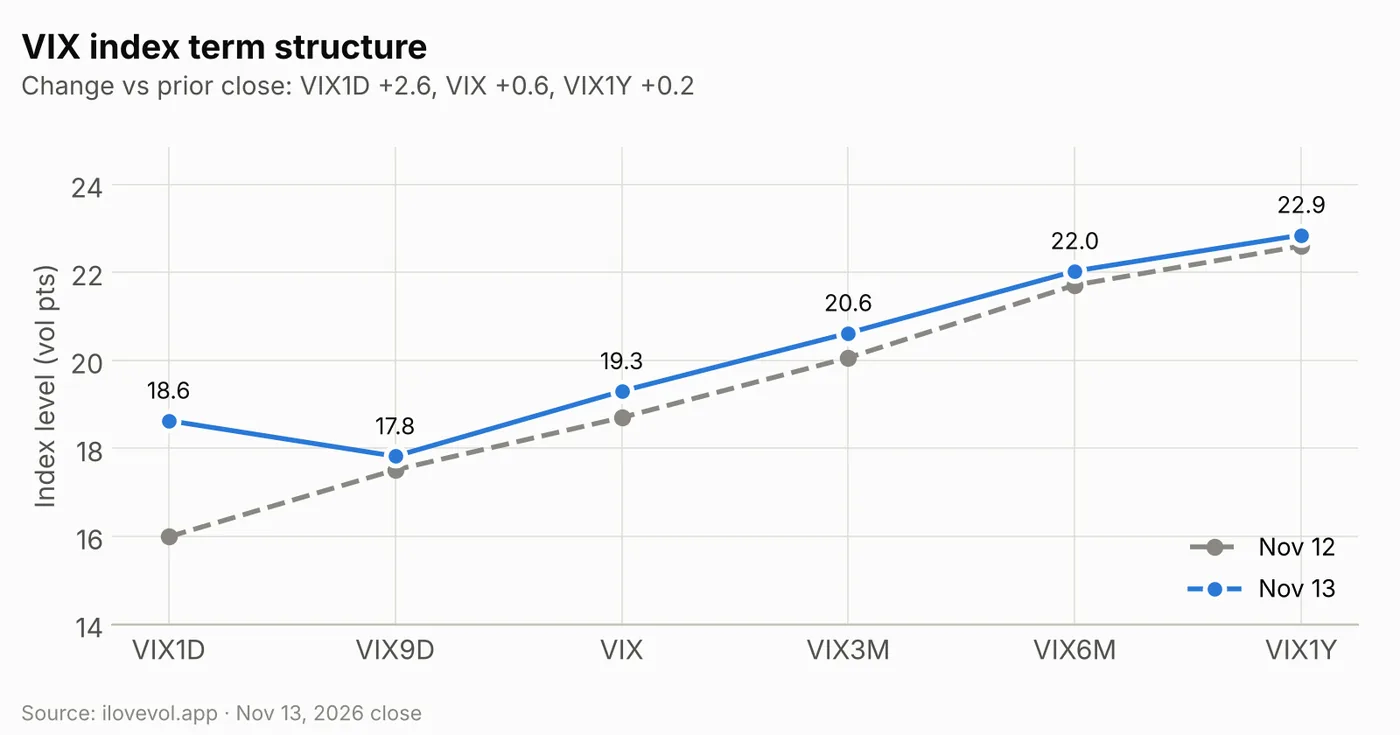
The move was concentrated in one-day vol. VIX1D rose 2.64 to 18.63, now above VIX9D (17.82, +0.31), while VIX added 0.60 to 19.30. Further out, VIX3M rose 0.56, VIX6M 0.32 and VIX1Y 0.25 to 22.85. Beyond the first point the curve still slopes upward, but the VIX-to-VIX1Y gap narrowed to 3.6 points from 3.9.
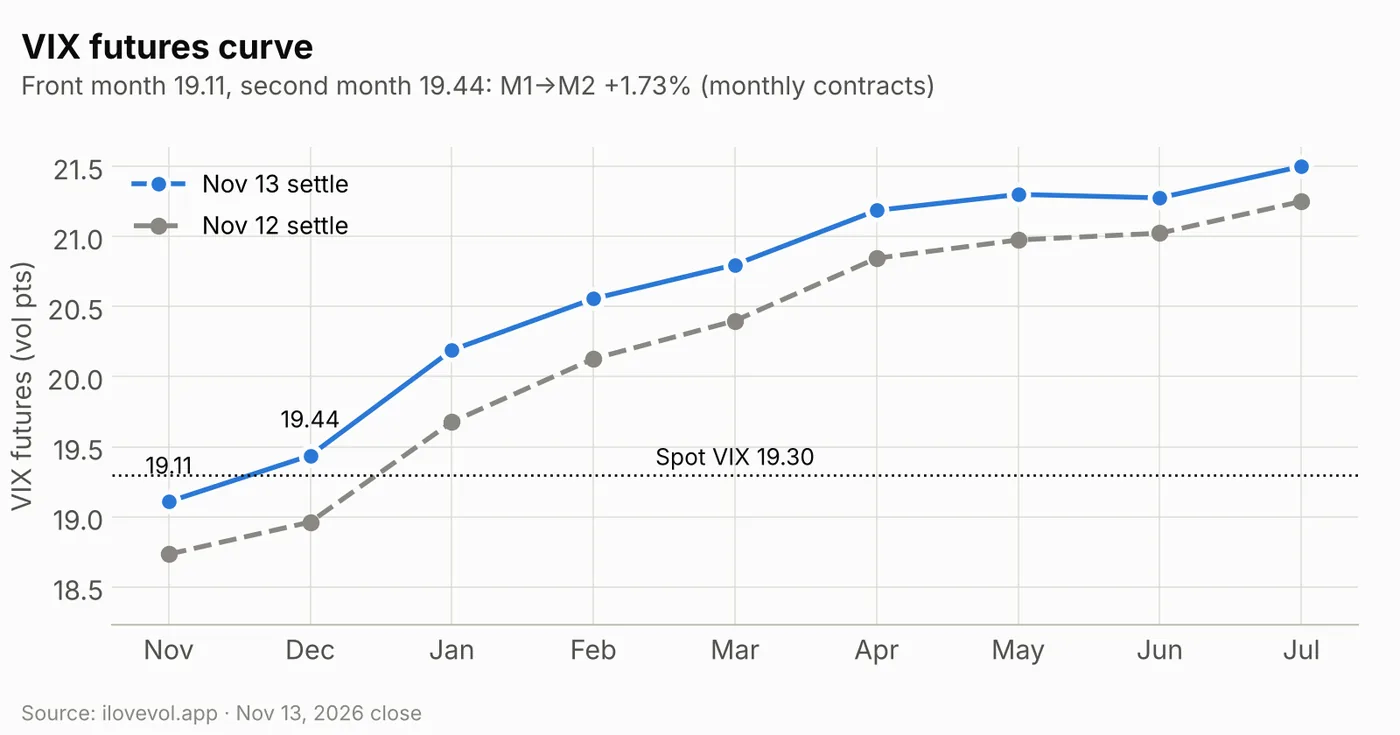
November futures settled at 19.11, up 0.37, and December at 19.44, up 0.48. January rose 0.51 to 20.19 and July 0.25 to 21.50. The curve is in contango and a little steeper at the front: M1→M2 is +1.73%, up from +1.22%. November now sits 0.19 under spot VIX, three sessions before its Wednesday expiration, so the futures market is pricing some of the current front-end vol to fade by then. VVIX rose 4.8 to 101.5, back above 100.
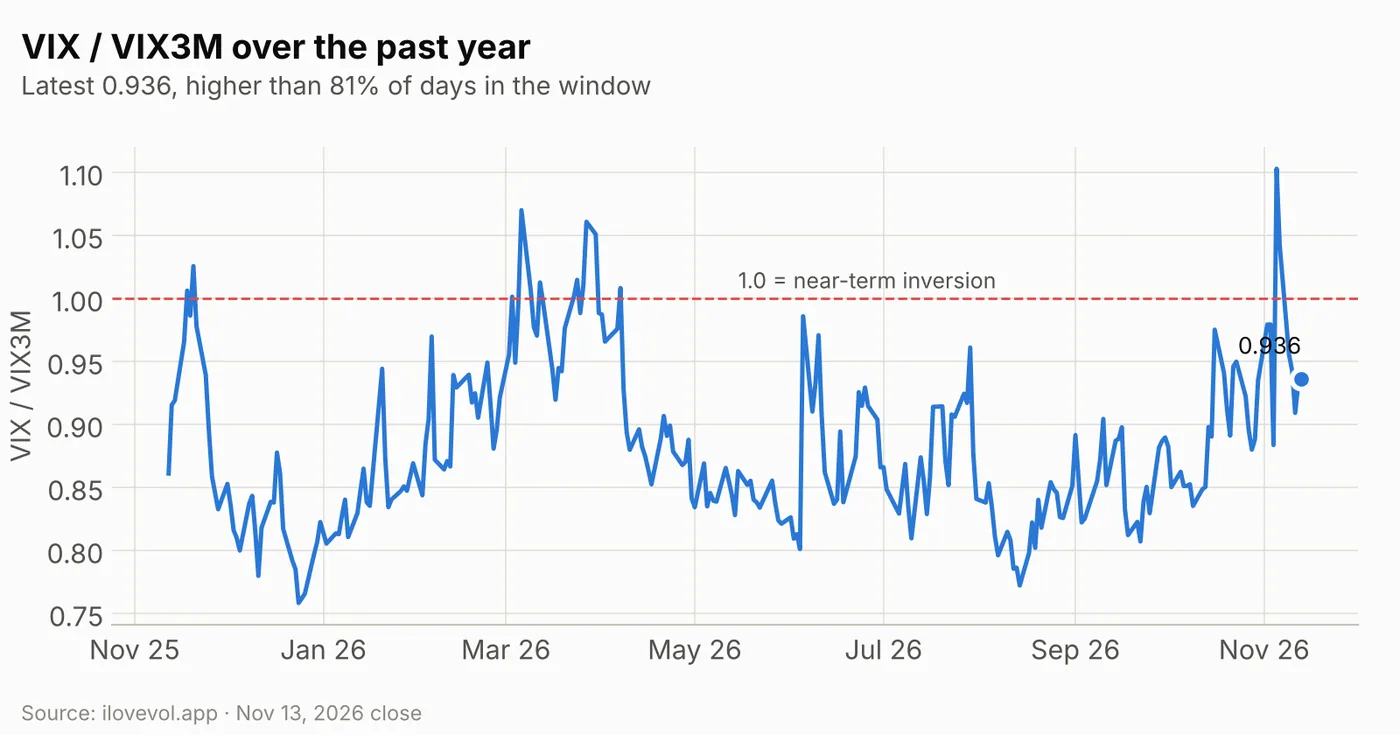
VIX/VIX3M edged up to 0.936 from 0.932, higher than 81% of the past year's sessions. One-month vol is elevated against three-month vol, but the ratio is still well below the 1.0 inversion line it crossed in early November.
4. Implied vs realized: the discount narrows
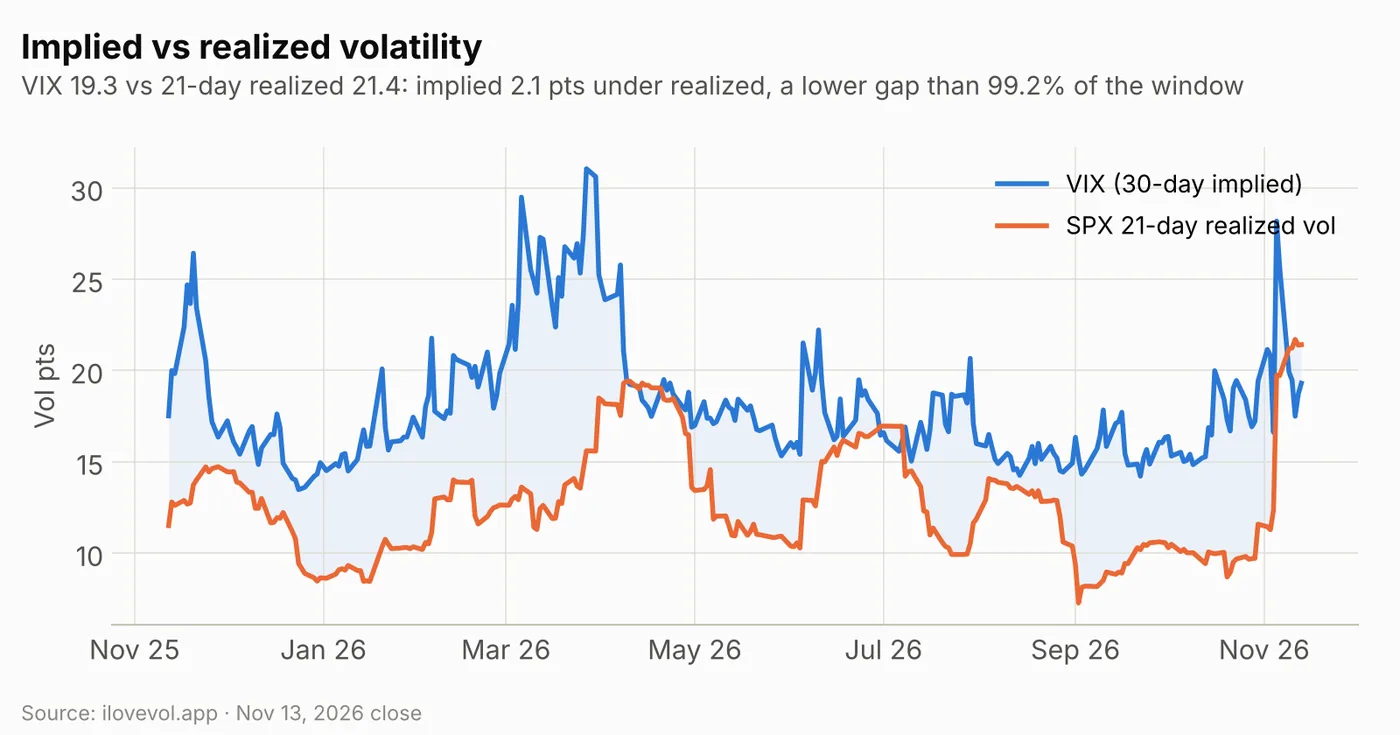
SPX 21-day realized vol is unchanged at 21.4. With VIX at 19.3, the gap narrowed to −2.1 points from −2.7, but only Wednesday and Thursday had a lower reading in the past year. Thirty-day ATM IV (14.8%) is still more than 6 points under realized. The large early-November moves, including a 4.5% drop, stay in the 21-day window until early December, so realized vol is likely to stay high even if the tape is quiet.
5. SPX surface: skew firms, the Nvidia week gets bid
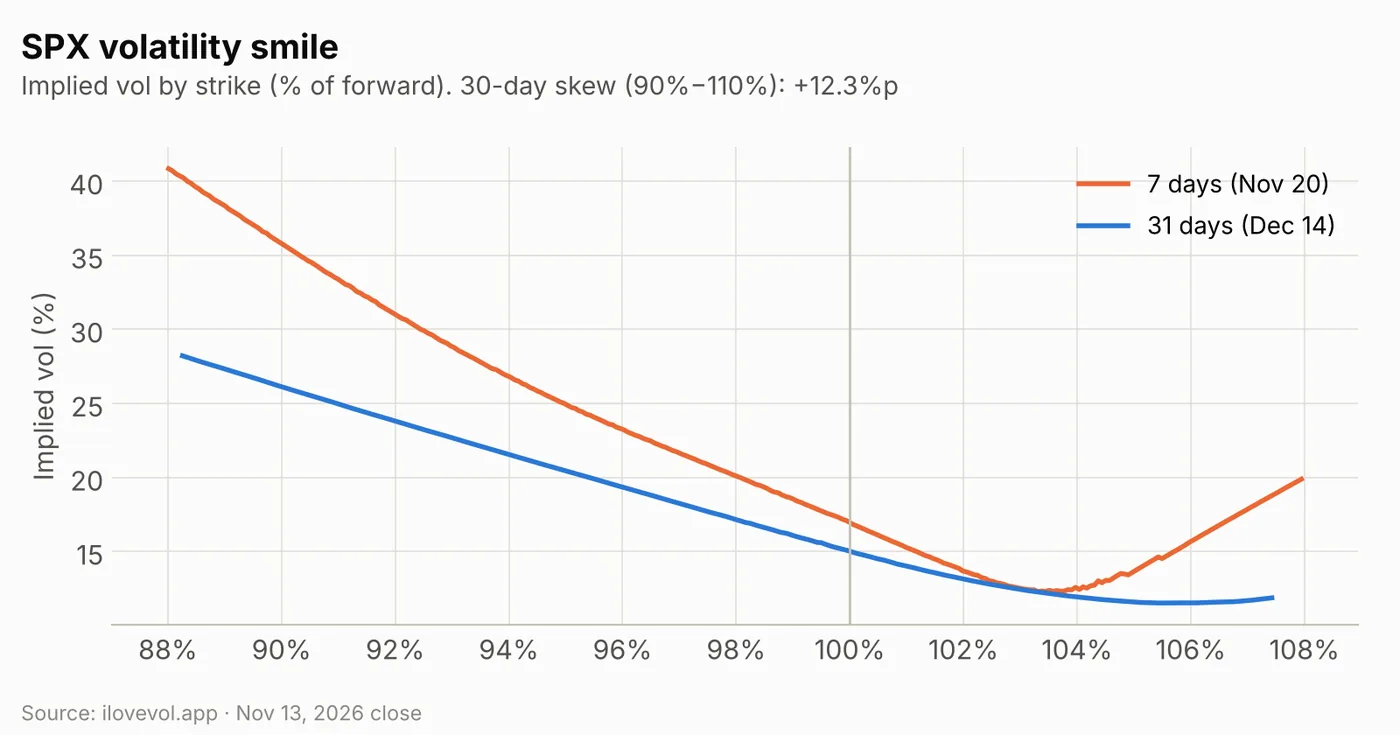
Thirty-day ATM IV rose to 14.8% from 14.3%, and 30-day skew (90% vs 110%) steepened to 12.3 points from 11.9. The 90-day minus 30-day slope is +0.3 points. The 7-day smile (Nov 20) runs from about 41% at 88% of the forward to about 17% at the money, bottoms near 12% around 103–104% and curls up to about 20% at 108%. The 31-day curve (Dec 14) runs from about 28% to a floor near 11.5% around 105–106%.
The expiry table shows the premium building through next week. Monday Nov 16 is 11.8% ATM (about 56 points) and Tuesday Nov 17 13.5%. Nov 18, the first expiry after Nvidia, is 15.2% (14.8% on Thursday), about 125 points through that day. Nov 19 is 15.7% and the Nov 20 monthly 15.6% (14.9% Thursday), about 166 points. After that the curve eases: 14.7% for Nov 23 and 13.9% for Nov 30.
6. Cross-asset Vol Sentiment: rates remain the stressed corner
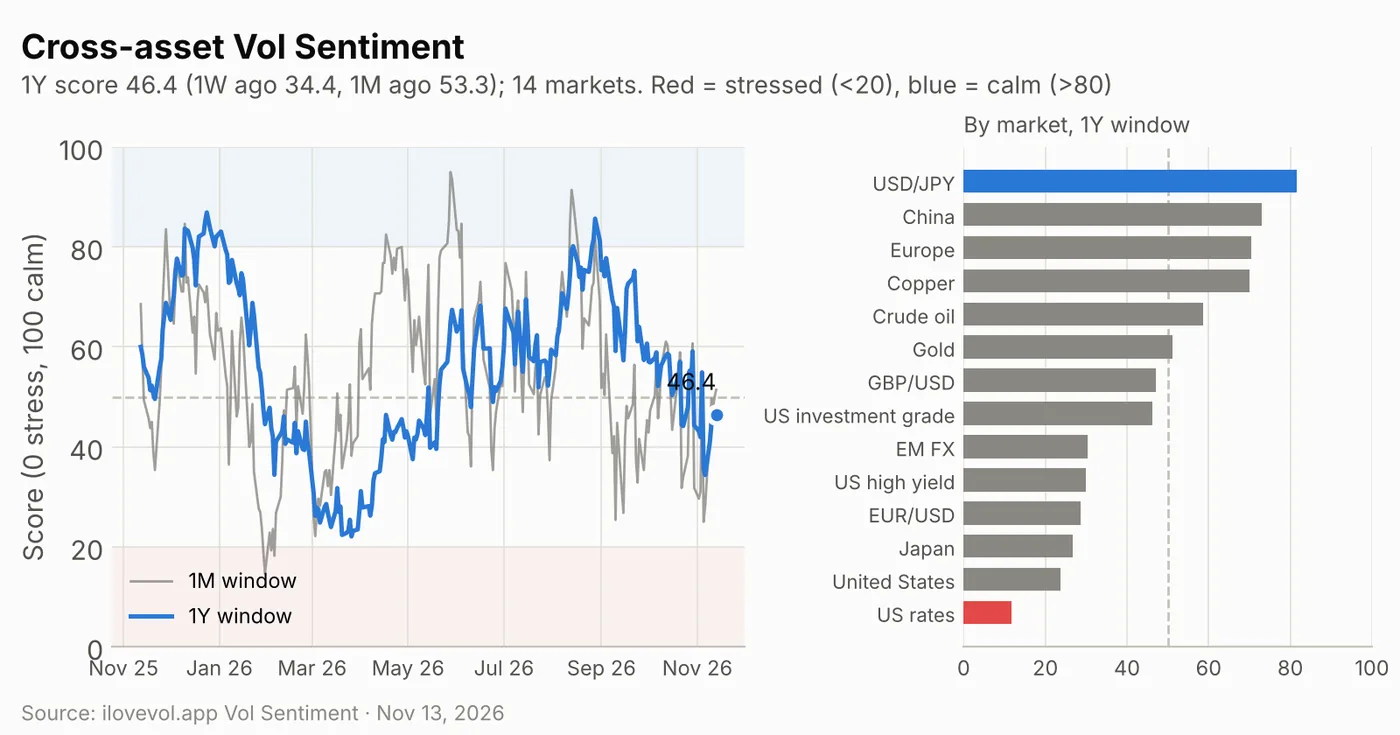
The cross-asset Vol Sentiment score places volatility in 14 equity, currency, rates, credit and commodity markets within its own one-year range (0 = stress, 100 = calm). On the one-year window it is 46.4, up slightly from 46.1 on Thursday (revised). It is still below the 50 midpoint and higher than only 33% of the past year's sessions; it is well above 34.4 a week ago but below 53.3 a month ago. The one-month window rose to 51.4 from 50.0 and the three-month window to 36.0 from 35.5.
Only one market is in the stressed zone below 20: US rates (11.7), as the 10-year yield pushed above 5.1%. US equities score 23.8 on the one-year window, near Japan (26.7), EUR/USD (28.8), US high yield (30.0) and EM FX (30.4). USD/JPY (81.7) is the only calm market, ahead of China (72.9), Europe (70.4) and copper (70.0). For the SPX picture, the backdrop is mixed rather than broad stress: European and Chinese equity vol are calm, while US equities and rates remain near the stressed end of their ranges. It is context, not a trading signal.
Calendar: the week ahead
Economic data & Fed
| Date | Time (ET) | Event | Note |
|---|---|---|---|
| Mon Nov 16 | 8:30 | Empire State manufacturing (Nov) | Williams 9:05; Fed Chair Warsh opening remarks 12:00 |
| Tue Nov 17 | 8:30 | Retail sales (Oct), import prices | Industrial production 9:15, NAHB 10:00; Nov 17 expiry 13.5% ATM |
| Wed Nov 18 | 8:30 | Housing starts and permits (Oct) | 20-year bond auction 13:00 (expected) |
| Wed Nov 18 | 14:00 | FOMC minutes (Oct 27–28 meeting) | December hike about 90% priced after PPI |
| Thu Nov 19 | 8:30 | Jobless claims, Philadelphia Fed survey (Nov) | Goolsbee 12:30 (expected) |
| Fri Nov 20 | 10:00 | University of Michigan sentiment (Nov, final) | Cook speaks 12:15 |
Earnings
| Date | Timing | Companies | Note |
|---|---|---|---|
| Mon Nov 16 | Before open | Tyson Foods (expected) | |
| Tue Nov 17 | Before open | Home Depot, Disney (expected) | |
| Tue Nov 17 | After close | Nvidia (first report under interim CEO Kress) | Nov 18 expiry 15.2% ATM vs 13.5% Nov 17 |
| Wed Nov 18 | Before open | Target, Lowe's, TJX (expected) | |
| Wed Nov 18 | After close | Palo Alto Networks (expected) | |
| Thu Nov 19 | Before open | Walmart, Alibaba (expected) | Nov 19 expiry 15.7% ATM |
| Thu Nov 19 | After close | Intuit (expected) |
Volatility dates (expirations, events)
| Date | Event | Note |
|---|---|---|
| Mon Nov 16 | Weekly SPX expiry | 11.8% ATM, about 56 pts; VIX1D 18.63 |
| Wed Nov 18 | First SPX expiry after Nvidia | 15.2% ATM, about 125 pts through Nov 18 |
| Wed Nov 18 | VIX November futures and options expiration | Nov future 19.11, 0.19 under spot VIX (19.30) |
| Wed Nov 18 / Thu Nov 19 | Anthropic IPO pricing (evening) and Nasdaq debut (expected) | |
| Fri Nov 20 | SPX November monthly expiration | 15.6% ATM, about 166 pts; inside the −$35.0B weekly window |
| Thu Nov 26 / Fri Nov 27 | Thanksgiving (closed) / 1:00 pm early close | |
| Mon Nov 30 | MSCI November index review takes effect at the close |
What I'm watching
- 7,600 to 7,635. The weekly call wall (7,600) and the three flips: all-expiry 7,624, weekly 7,631, monthly 7,635. The modeled profile goes from about −$13B at 7,600 to +$28B at 7,650, so a move back through this band would flip dealers to long gamma quickly.
- 7,500. The weekly and monthly put wall and the largest negative strike (−$8.5B). The profile is about −$46B at 7,550 and −$71B at 7,500, so a slide toward it would meet growing hedging pressure rather than support.
- The Nov 18–20 expiries. Without them, modeled gamma at spot is about −$12B instead of −$39B. How SPX trades through Nvidia, the VIX expiration and the monthly decides how much of the short gamma is still there on Nov 23.
- Event premiums. Nov 18 at 15.2% ATM vs 13.5% for Nov 17, and about 166 points priced through the Nov 20 monthly. Friday's PPI expiry priced about 81 points and SPX moved 31.
- The front of the VIX curve. VIX1D (18.63) is above VIX9D (17.82), the November future sits 0.19 under spot and VVIX is back above 100. Realized vol (21.4) is still above VIX (19.3).
Sources
- Yahoo Finance: Stock market today: Dow rises, S&P 500 and Nasdaq slip to cap volatile week, Nvidia stock plunge deepens
- Kiplinger: Nasdaq Drops Friday But Ends the Week Up: Stock Market Today
- 24/7 Wall St.: S&P 500 Closes Down 0.4% as Tech Drags and the Dow Holds Green
- Federal Reserve: Calendar, November 2026
- ThriveInMarkets: Economic Calendar, Nov 16–20, 2026
- Census Bureau: Economic indicator calendar 2026
- Newsquawk: Fed Speak primer and schedule
- TheStreet Pro: Earnings Calendar, Week of Nov 16 – Nov 20, 2026
- Earnings Whispers: Earnings calendar, week of Nov 16, 2026
- NVIDIA IR: Conference Call for Third-Quarter Financial Results
- Macroption: VIX Expiration Calendar 2026
Volatility data: ilovevol.app. GEX assumes dealers are long calls and short puts. VIX futures use settlement prices. Implied moves are approximations from expiry ATM IV over the trading sessions to expiry. Vol Sentiment: ilovevol.app cross-asset score (0 = stress, 100 = calm), one-year window unless noted; day-over-day changes use the latest (revised) prior row.
This review is for informational and educational purposes only and is not investment advice. See the disclaimer.
The Daily Vol sends this review to your inbox each trading day: dealer gamma levels, the VIX curves, the SPX vol surface and the levels to watch. Free, one click to unsubscribe.