Home › Blog › Daily Market Review
Daily Market Review · US close
SPX drops 1.9% before Nvidia, short gamma hits −$91.1B and VIX futures invert
SPX fell 1.92% to 7,417, 184 points under its 7,600 flip, and net GEX dropped from −$54.2B to −$91.1B. VIX jumped 3.61 to 22.91, the November future settled above December again, and the first SPX expiry after Nvidia now prices 24.6% ATM vol.
- Tech led a broad selloff a day before Nvidia's first report since its CEO exit. SPX −1.92% to 7,417, NDX −2.67%, Dow −1.41%, Russell 2000 −1.70%; AMD −5.6%, Intel −7.0%, Dell −7.0%, Nvidia −4.1%. Empire State manufacturing slumped to 7.8.
- Net GEX fell from −$54.2B to −$91.1B, and SPX is now 184 points under a 7,600 flip. The Nov 17–20 expiries hold about half of the modeled short gamma at spot.
- VIX rose 3.61 to 22.91, VIX9D 5.33 to 23.15 and VVIX to 114.2. VIX futures flipped to backwardation at the front (Nov 22.53 vs Dec 21.11), and the post-Nvidia Nov 18 expiry jumped to 24.6% ATM from 15.2%.
Scoreboard
| Close | Chg | Prev | |
|---|---|---|---|
| SPX | 7,417 | −1.92% | 7,562 |
| NDX | 27,197 | −2.67% | 27,944 |
| VIX | 22.91 | +3.61 | 19.30 |
| VIX1D | 19.78 | +1.15 | 18.63 |
| VVIX | 114.2 | +12.7 | 101.5 |
| VX Nov / Dec | 22.53 / 21.11 | −6.32% M1→M2 | +1.73% |
| VIX / VIX3M | 0.995 | +0.059 | 0.936 |
| 30D ATM IV / skew | 18.0% / 15.1 | +3.2 / +2.8 | 14.8% / 12.3 |
| Window | Net GEX | Chg | Prev | Flip | Call wall | Put wall | |
|---|---|---|---|---|---|---|---|
| SPX | All | −$91.1B | −$36.9B | −$54.2B | 7,600 | 8,000 | 7,000 |
| SPX | Weekly | −$48.8B | −$13.8B | −$35.0B | 7,618 | 7,500 | 7,400 |
| SPX | Monthly | −$66.4B | −$20.1B | −$46.3B | 7,622 | 7,500 | 7,400 |
| NDX | All | −$3.29B | −$1.74B | −$1.55B | 28,154 | 28,000 | 27,000 |
| NDX | Weekly | −$1.15B | −$0.72B | −$0.43B | 27,718 | 28,000 | 27,000 |
| NDX | Monthly | −$1.61B | −$0.74B | −$0.87B | 27,900 | 28,000 | 27,000 |
Dealer gamma by expiry window. All = every listed expiry; Weekly = contracts expiring within 7 calendar days; Monthly = within 30 days. Net GEX in $ per 1% move.
1. The tape: a broad tech selloff on the eve of Nvidia
The S&P 500 fell 145 points (1.92%) to 7,417, its third straight decline and its biggest drop since the Nov 5 slide. The Nasdaq Composite lost 2.49% to about 24,510, the Nasdaq-100 2.67% to 27,197, the Dow 1.41% (739 points) to about 51,608 and the Russell 2000 1.70% to 2,743. Real estate held up best, while communication services and technology led the decline, according to The Motley Fool.
Chips and the AI build-out names took the heaviest losses again. Nvidia fell 4.1% to about $156 a day before its fiscal third-quarter report, its first since Jensen Huang stepped down as CEO, with Colette Kress serving as interim chief. The Motley Fool also pointed to new US export restrictions on advanced AI chips to Southeast Asian countries: AMD dropped 5.6%, Intel 7.0% and Dell 7.0%. Alphabet lost about 4%, Amazon 3.3%, Tesla 2.7% and Meta 2.4%; Microsoft and Apple fell about 1%. Tyson Foods rose 8.7% after its results. Vista Partners also cited a string of service outages, including online-banking problems at several large banks, and a California lawsuit against OpenAI as part of the risk-off tone.
Data did not help. The Empire State manufacturing index fell to 7.8 from 25.5 in October, well below the 17.6 consensus, with new orders down to 3.0. Fed Governor Bowman's remarks on corporate debt levels were read as hawkish for debt-financed AI spending, per The Motley Fool. Treasury yields stayed near 5.1% on the 10-year (sources differ on the direction of the day's move), gold fell almost 1% to about $3,850, and December WTI dropped about 3.4% to roughly $85.50 on recovering Strait of Hormuz exports, per Vista Partners. Anthropic's IPO is expected to begin trading on Thursday.
Why it matters for vol: Monday's SPX expiry priced about 56 points and the index moved 145. The selloff came with dealers already short gamma, and it pushed the market further down the steep part of the curve. Implied vol repriced across the board, but the biggest change was at the front: the November VIX future, two sessions from expiry, now trades above December.
2. Dealer gamma: the deepest short of the cycle
Net GEX across all expiries fell to −$91.1B per 1% move from −$54.2B. The flip moved down to 7,600 from 7,624, and SPX closed 184 points (2.4%) below it, against 62 points on Friday. As on Friday, most of the change is price: the close slid 145 points further down a curve that steepens below the flip.
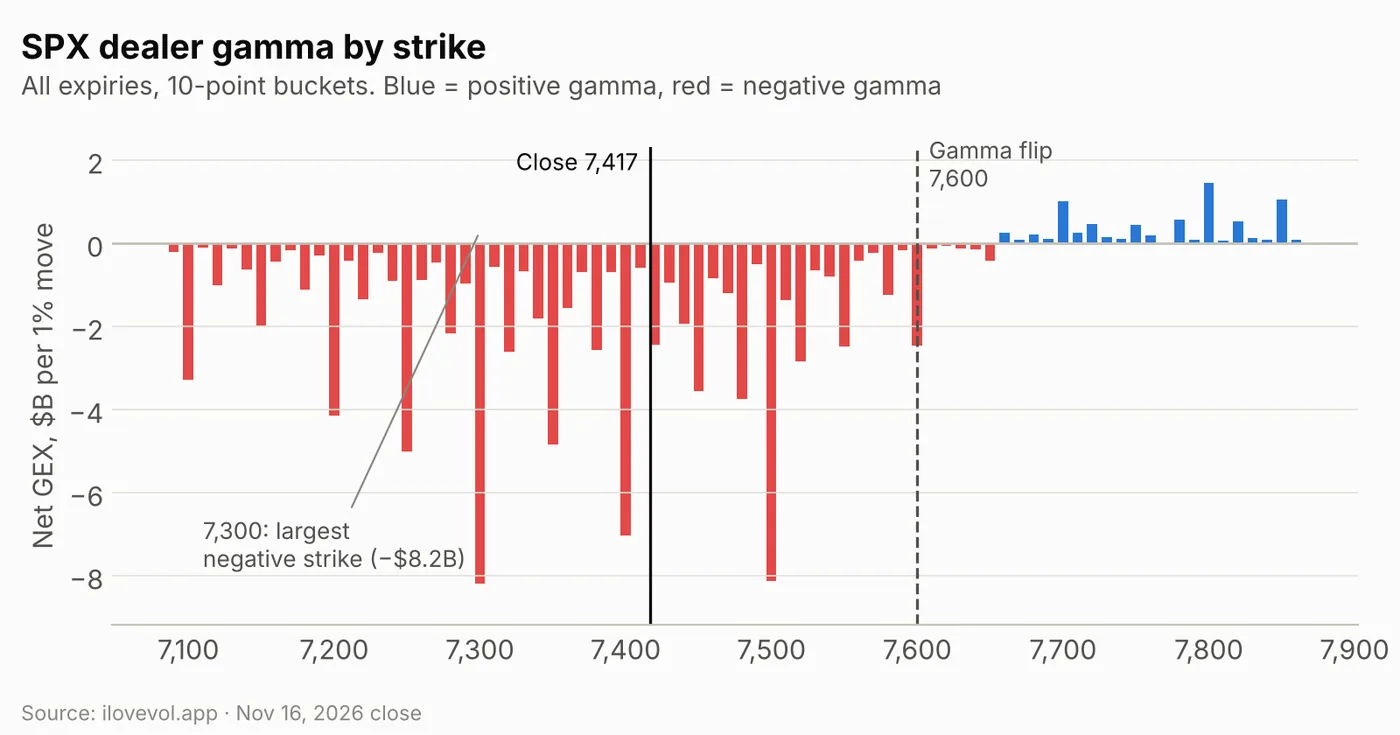
Every 10-point bucket from 7,090 up to 7,650 is negative; the first positive bucket above spot is 7,660. The largest negative buckets are 7,300 (−$8.2B) and 7,500 (−$8.1B), followed by 7,400 (−$7.0B), 7,250 (−$5.0B) and 7,350 (−$4.8B). The positive side is thin: 7,800 (+$1.5B), 7,850 (+$1.1B) and 7,700 (+$1.0B) are the largest.
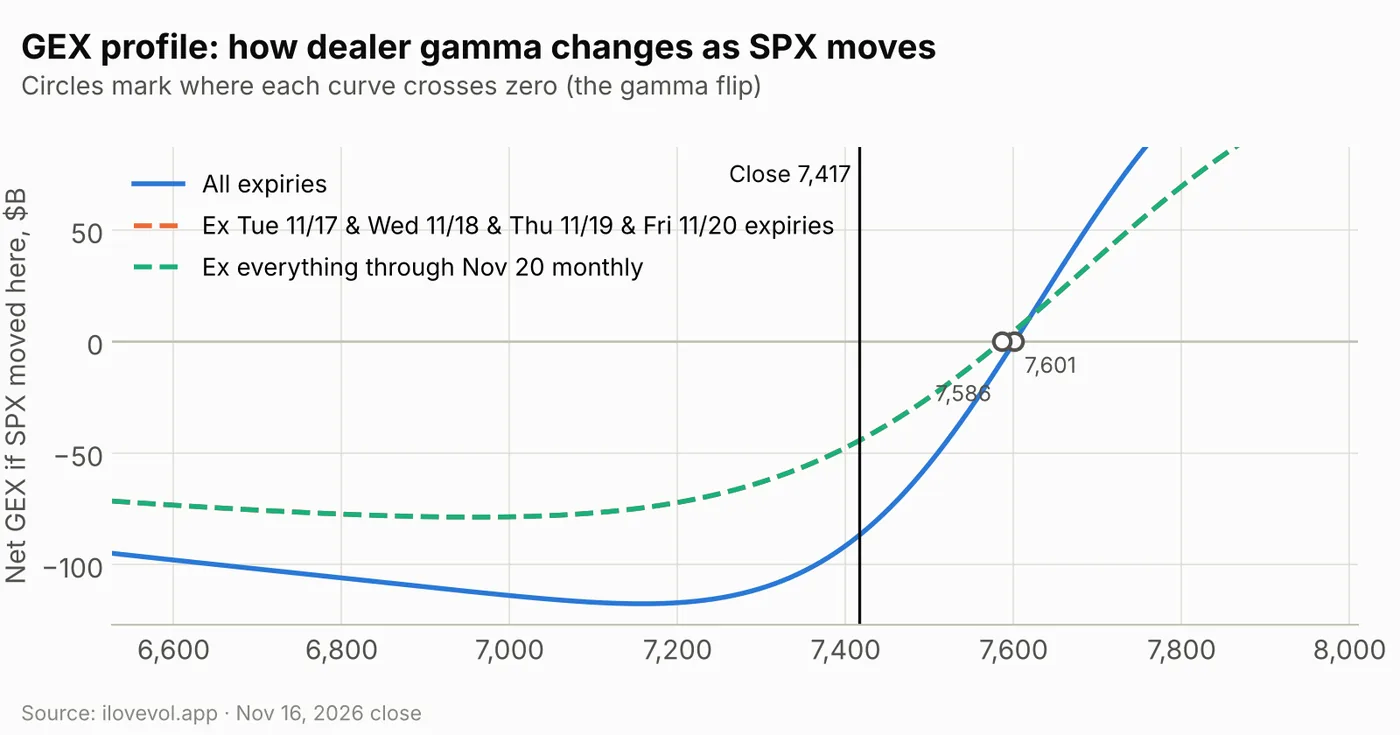
The modeled profile reads about −$87B at the close and crosses zero near 7,601. It is steepest above spot: about −$55B at 7,500, −$29B at 7,550 and zero at 7,600. Below spot it flattens: −$92B at 7,400, −$111B at 7,300 and a floor of about −$118B near 7,160. In other words, a further drop adds less short gamma per point than a rebound would remove.
This week's four expiries carry about half of it. The two dashed curves coincide today, because removing the Nov 17–20 expiries is the same as removing everything through the Nov 20 monthly. Without them, modeled gamma at spot is about −$44B instead of −$87B, and the flip is near 7,586. The other half sits in later expiries, mainly December, so the market stays short gamma at this price even after Friday's monthly rolls off.
Weekly vs monthly: the walls move down with the market
The three SPX flips sit in a 22-point band 184–206 points above the close: all-expiry 7,600, weekly 7,618, monthly 7,622 (numbers in the dealer-gamma table under the scoreboard). The weekly and monthly call walls both dropped to 7,500 and the put walls to 7,400, so the close now sits between the two.
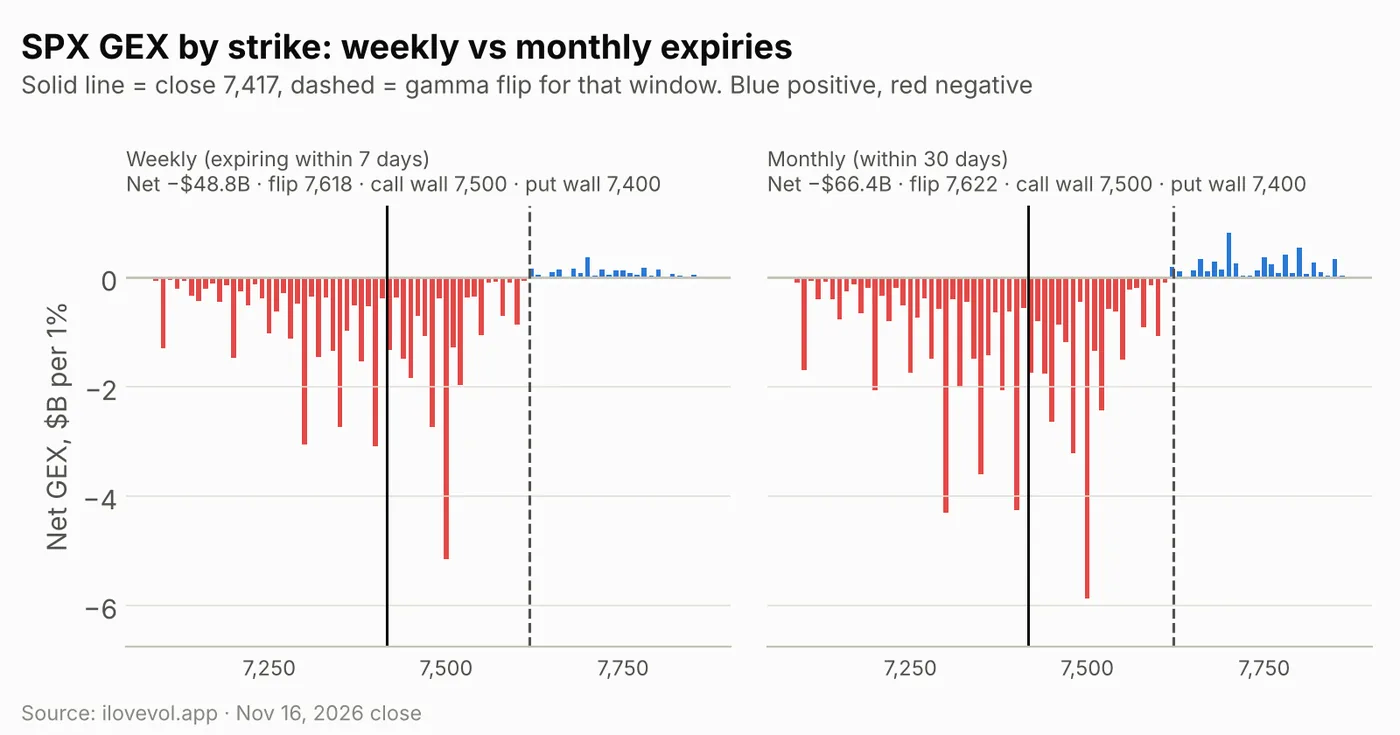
SPX weekly: the next 7 days hold −$48.8B, down from −$35.0B, across five expiries from Nov 17 to Nov 23. That is about 54% of the all-expiry total, down from 65% on Friday, because the longer-dated book deepened faster. The flip is 7,618, the call wall moved down to 7,500 from 7,600 and the put wall to 7,400 from 7,500. The largest weekly buckets are 7,500 (−$5.1B), 7,400 (−$3.1B) and 7,300 (−$3.1B); the largest positive one is only 7,700 (+$0.4B).
SPX monthly: the 30-day window deepened to −$66.4B from −$46.3B, with the flip at 7,622, the call wall at 7,500 and the put wall at 7,400. Its largest buckets are 7,500 (−$5.9B), 7,300 (−$4.3B) and 7,400 (−$4.3B). That leaves about −$17.6B in expiries 8–30 days out, against −$11.3B on Friday. Everything beyond 30 days now nets to about −$24.7B, against −$7.9B, so the longer-dated book adds to the short gamma instead of offsetting it.
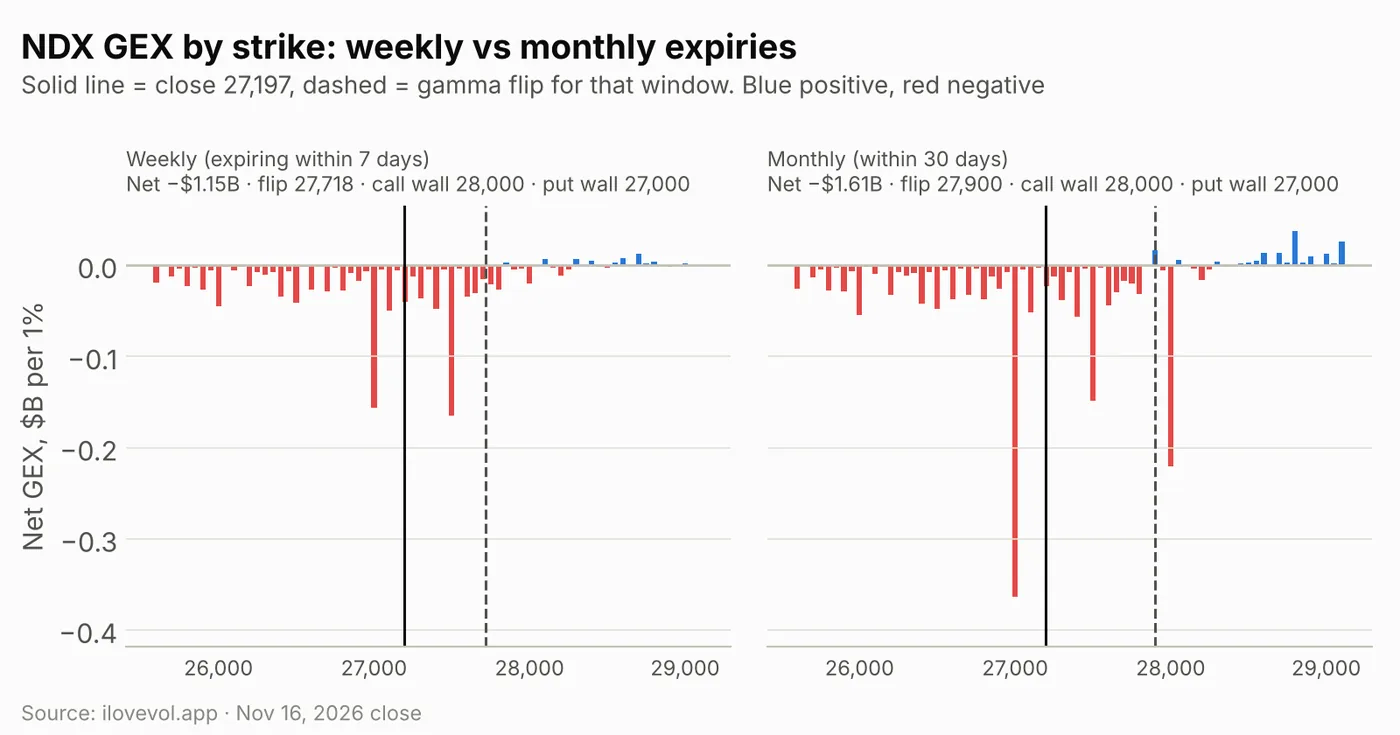
NDX fell 2.67% to 27,197 and its short gamma more than doubled to −$3.29B from −$1.55B, 957 points under its 28,154 flip. The weekly window deepened to −$1.15B from −$0.43B (flip 27,718, call wall 28,000, put wall 27,000), leaving the index 521 points under the weekly flip. The monthly window is −$1.61B (flip 27,900, call wall 28,000, put wall 27,000); its largest buckets are 27,000 (−$0.36B), 28,000 (−$0.22B) and 27,500 (−$0.15B).
RUT fell 1.70% to 2,743 and its short gamma deepened to −$2.75B from −$1.84B, 91 points under its 2,834 flip, with the call wall at 2,765 and the put wall at 2,700.
3. The VIX complex: the front end inverts
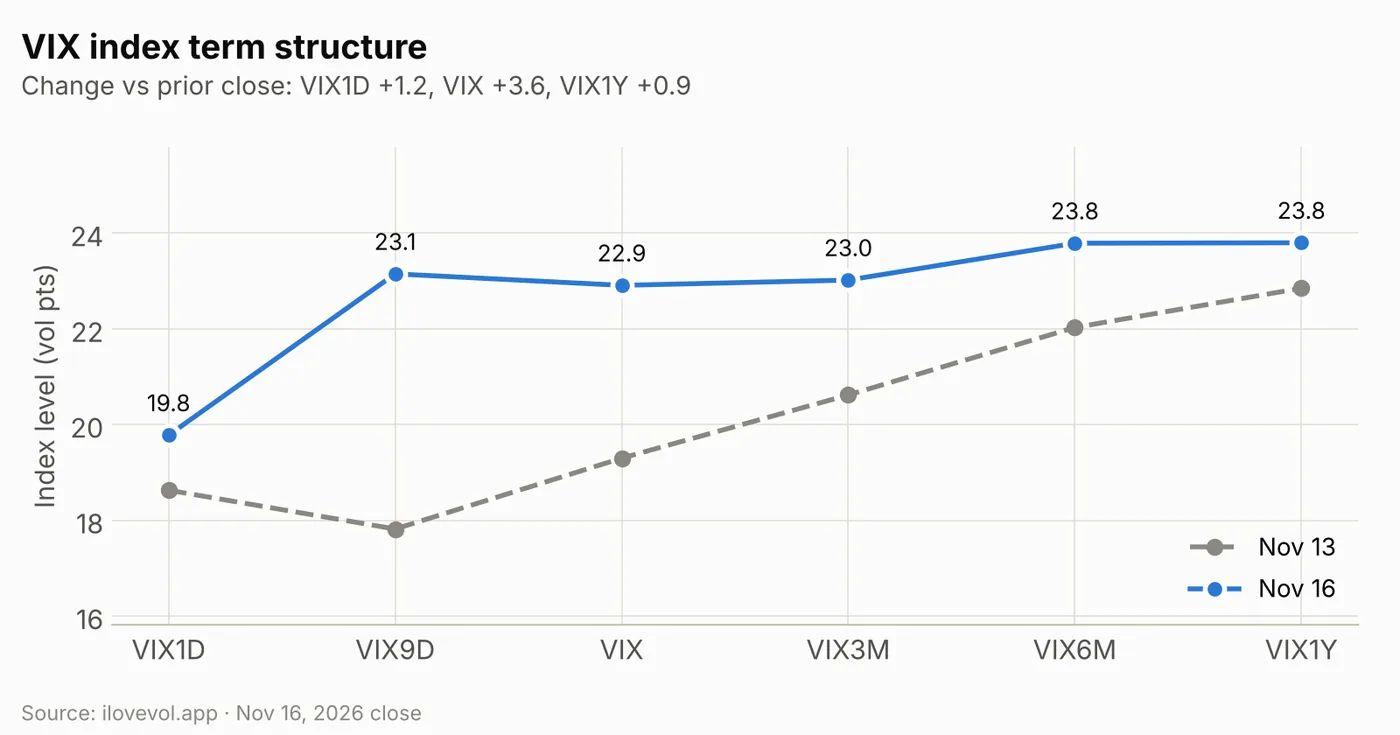
The repricing was centered on the next two weeks. VIX9D jumped 5.33 to 23.15, now above VIX (22.91, +3.61), while VIX1D rose a more modest 1.15 to 19.78 because Tuesday's session ends before Nvidia reports. Further out, VIX3M rose 2.40 to 23.02, VIX6M 1.76 to 23.79 and VIX1Y 0.95 to 23.80. The curve from VIX to VIX1Y is now almost flat: the gap shrank to 0.9 points from 3.6.
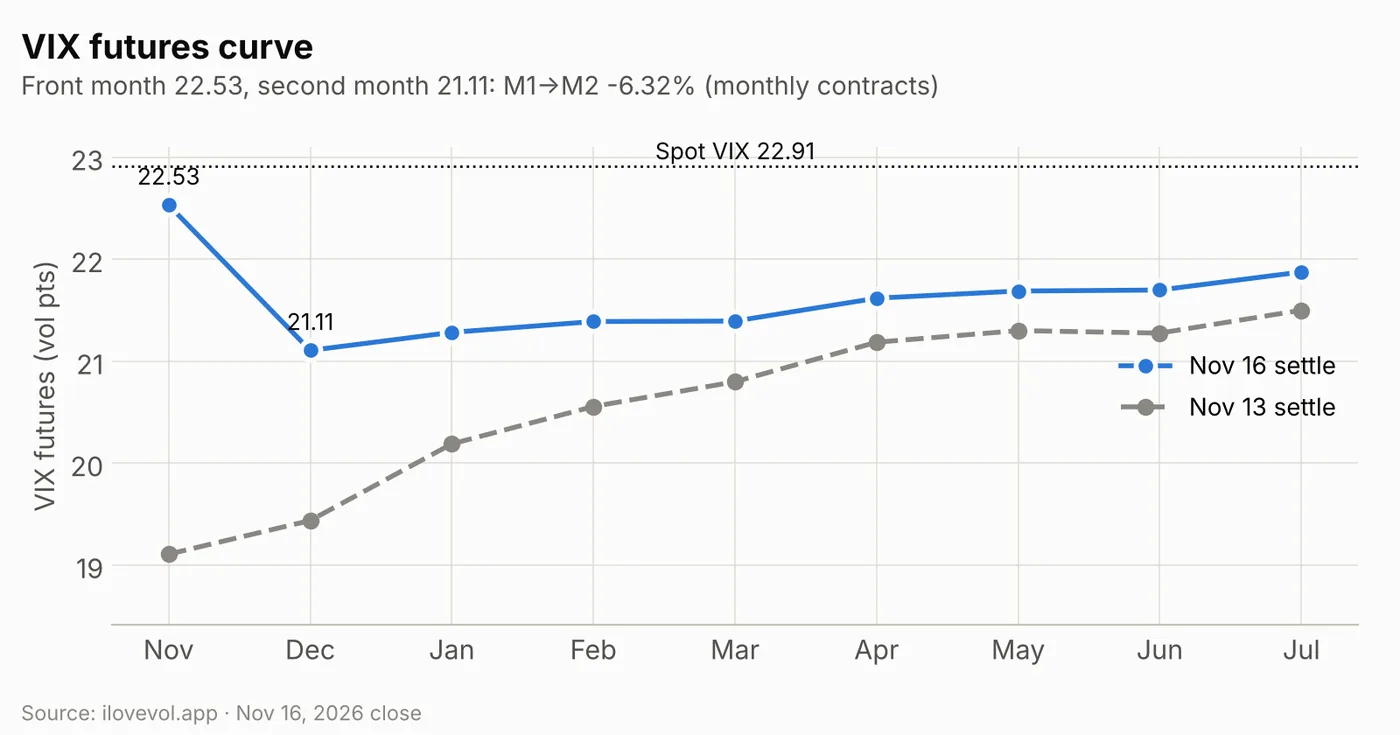
November futures settled at 22.53, up 3.42, and December at 21.11, up 1.67. January rose 1.09 to 21.28 and July 0.38 to 21.88. The front of the curve is back in backwardation for the first time since Nov 10: M1→M2 is −6.32%, from +1.73% on Friday. Beyond December the curve still slopes gently upward, so the inversion is a two-month kink around this week's events rather than a full curve inversion. November, which expires Wednesday morning, settled 0.38 under spot VIX. VVIX rose 12.7 to 114.2.
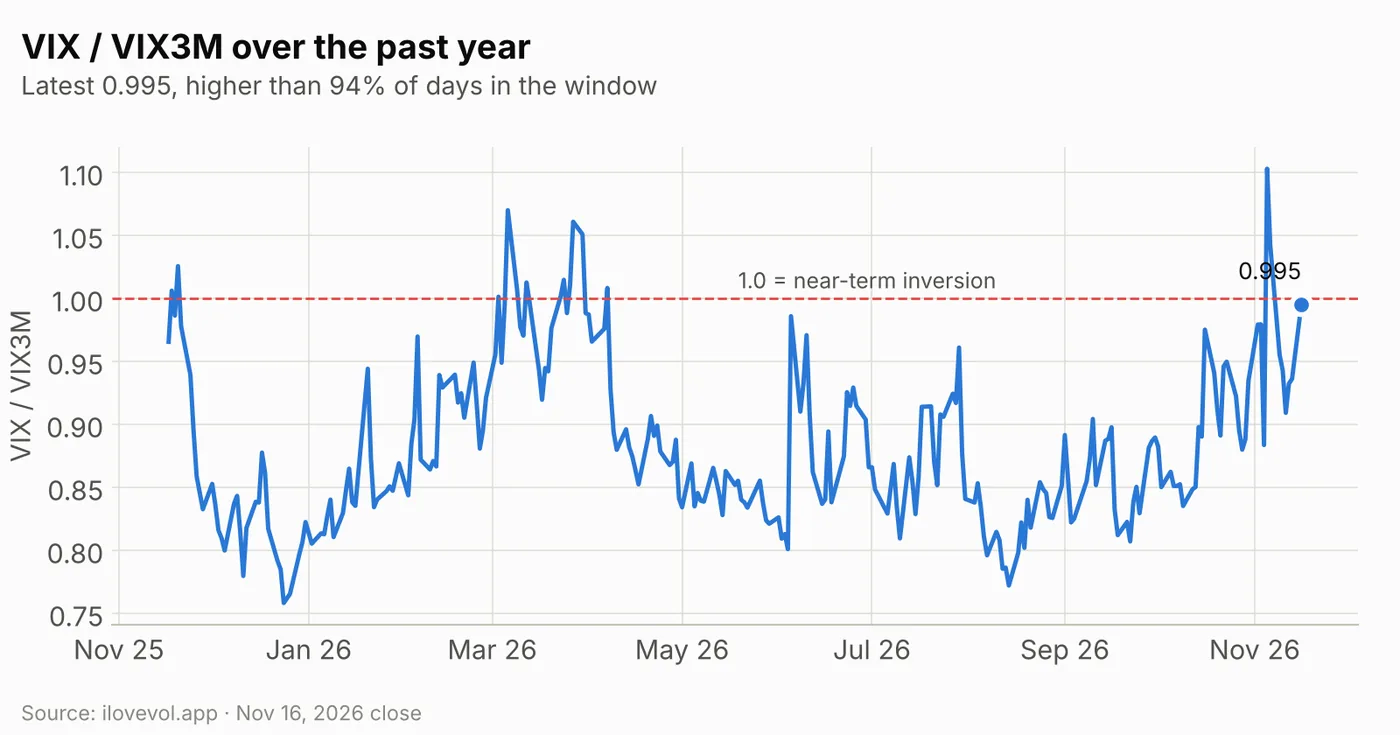
VIX/VIX3M jumped to 0.995 from 0.936, higher than 94% of the past year's sessions and just under the 1.0 inversion line. It last crossed 1.0 on Nov 5–6, when it reached 1.103.
4. Implied vs realized: VIX moves back above realized
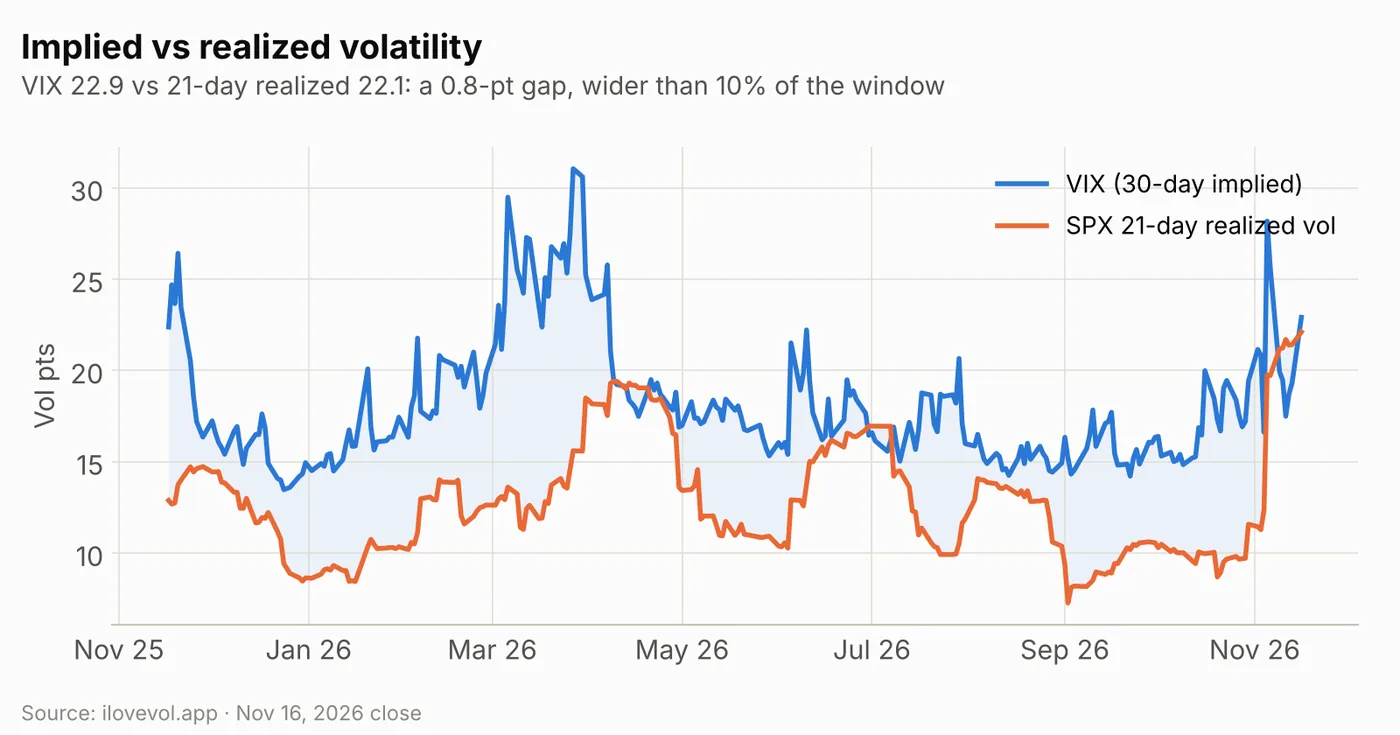
SPX 21-day realized vol rose to 22.1 from 21.4. With VIX at 22.9, the gap turned positive at +0.8 points from −2.1, the first time since Nov 6 that VIX closed above realized. The spread is still thin by the past year's standards (only 10% of sessions had a lower reading), and 30-day ATM IV (18.0%) remains about 4 points under realized. The early-November swings stay in the 21-day window until early December, and Monday's 1.9% drop now adds to them.
5. SPX surface: skew steepens, the Nvidia expiry reprices
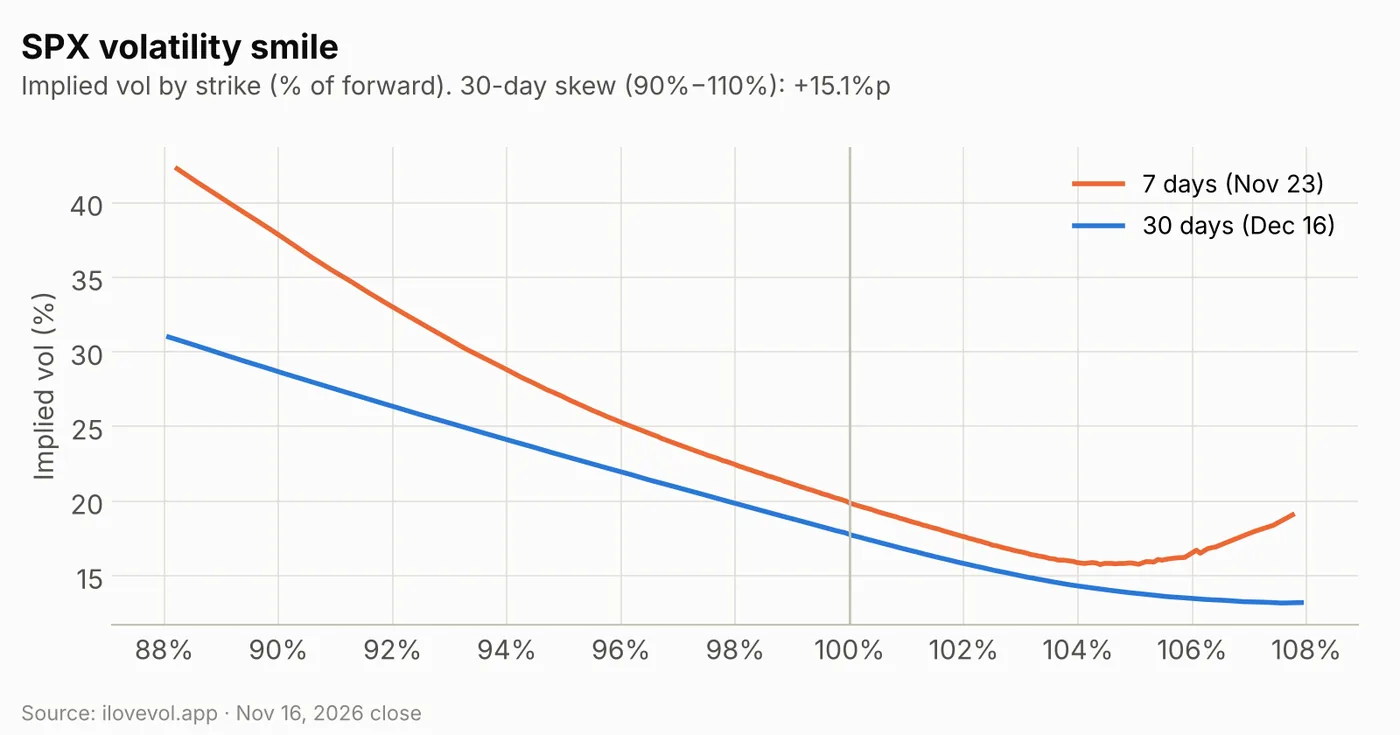
Thirty-day ATM IV rose to 18.0% from 14.8%, and 30-day skew (90% vs 110%) steepened to 15.1 points from 12.3. The 90-day minus 30-day slope turned negative at −1.0 point from +0.3, so near-dated vol now sits above three-month vol on the surface too. The 7-day smile (Nov 23) runs from about 42% at 88% of the forward to about 20% at the money, bottoms near 16% around 104–105% and curls up to about 19% at 108%. The 30-day curve (Dec 16) runs from about 31% to about 13%.
The expiry table shows where the premium sits. Tuesday Nov 17, which closes before Nvidia reports, is 22.8% ATM (about 106 points). Nov 18, the first expiry after Nvidia, is 24.6% (15.2% on Friday), about 163 points through that day; the implied forward vol for that one session is about 26%. Nov 19 is 24.2% and the Nov 20 monthly 23.2% (15.6% Friday), about 217 points. After that the curve eases: 20.3% for Nov 23 and 18.1% for Nov 30.
6. Cross-asset Vol Sentiment: Friday's reading, before Monday's jump
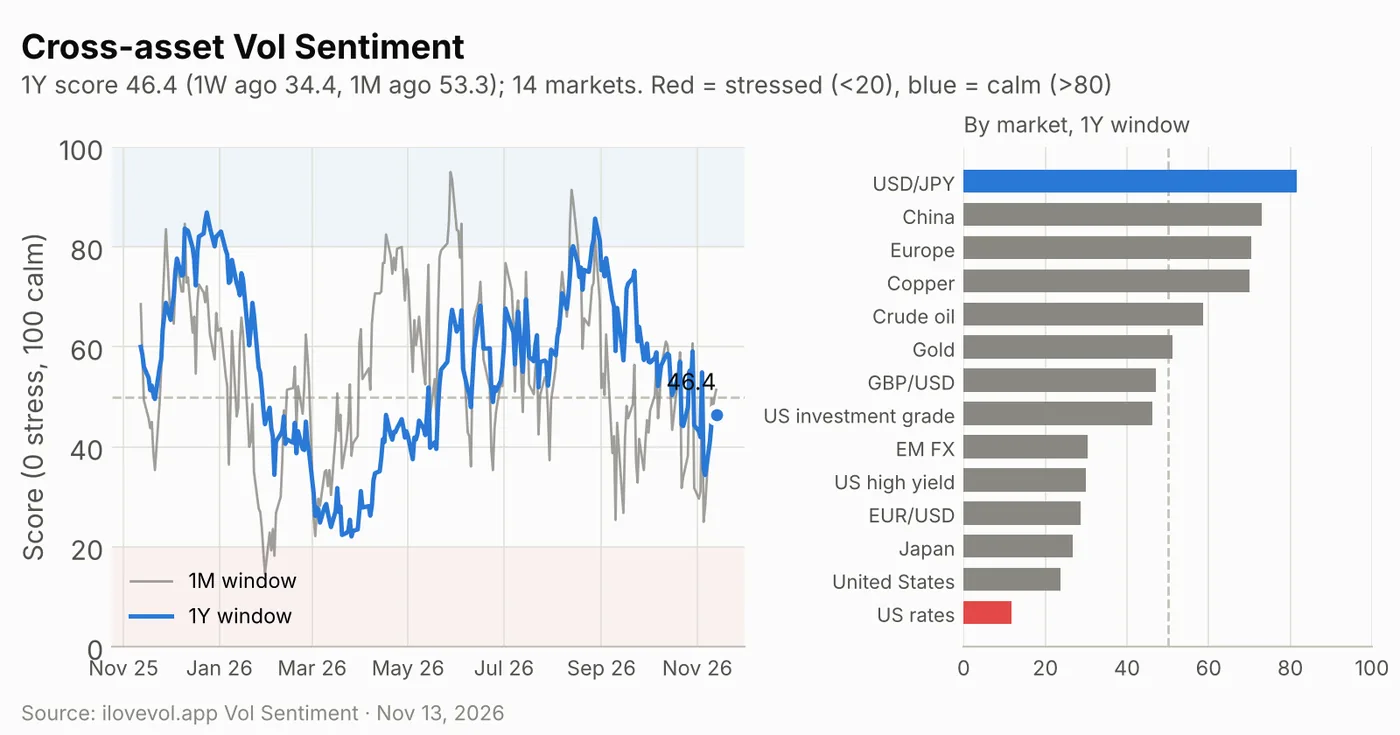
The cross-asset Vol Sentiment score places volatility in 14 equity, currency, rates, credit and commodity markets within its own one-year range (0 = stress, 100 = calm). The Nov 16 row was not yet available at publication, so this section uses the latest day, Friday Nov 13. On the one-year window the score was 46.4, up slightly from 46.1 on Thursday, below the 50 midpoint and higher than only 33% of the past year's sessions. It was well above 34.4 a week earlier but below 53.3 a month earlier. The one-month window was 51.4 and the three-month window 36.0.
Only one market was in the stressed zone below 20: US rates (11.7). US equities scored 23.8 on the one-year window, near Japan (26.7), EUR/USD (28.8), US high yield (30.0) and EM FX (30.4). USD/JPY (81.7) was the only calm market, ahead of China (72.9), Europe (70.4) and copper (70.0). The US equities input is the VIX, so Monday's 3.61-point jump is not in this reading. On Friday's data the backdrop was mixed rather than broad stress, with US equities and rates at the stressed end of their ranges while European and Chinese equity vol stayed calm. It is context, not a trading signal.
Calendar: the week ahead
Economic data & Fed
| Date | Time (ET) | Event | Note |
|---|---|---|---|
| Tue Nov 17 | 8:30 | Retail sales (Oct), import prices | Consensus +0.2% m/m; industrial production 9:15, NAHB 10:00; Waller 9:10, Williams 14:25 |
| Wed Nov 18 | 8:30 | Housing starts and permits (Oct) | 20-year bond auction 13:00; Barr 13:35 |
| Wed Nov 18 | 14:00 | FOMC minutes (Oct 27–28 meeting) | Rates held at 3.75–4.00% with two hike dissents; Kashkari 16:15 |
| Thu Nov 19 | 8:30 | Jobless claims, Philadelphia Fed survey (Nov) | Goolsbee 12:30, Barkin 16:00 (expected) |
| Fri Nov 20 | 10:00 | University of Michigan sentiment (Nov, final) | Waller 8:25, Cook 12:15 |
Earnings
| Date | Timing | Companies | Note |
|---|---|---|---|
| Tue Nov 17 | Before open | Home Depot, Disney | Nov 17 expiry 22.8% ATM |
| Tue Nov 17 | After close | Nvidia (first report under interim CEO Kress) | Nov 18 expiry 24.6% ATM vs 22.8% Nov 17 |
| Wed Nov 18 | Before open | Target, Lowe's, TJX | |
| Wed Nov 18 | After close | Palo Alto Networks | |
| Thu Nov 19 | Before open | Walmart, PDD Holdings | Nov 19 expiry 24.2% ATM |
| Thu Nov 19 | After close | Intuit, Ross Stores, Keysight, Gap |
Volatility dates (expirations, events)
| Date | Event | Note |
|---|---|---|
| Tue Nov 17 | Weekly SPX expiry (before Nvidia reports) | 22.8% ATM, about 106 pts; VIX1D 19.78 |
| Wed Nov 18 | First SPX expiry after Nvidia | 24.6% ATM, about 163 pts through Nov 18 |
| Wed Nov 18 | VIX November futures and options expiration | Nov future 22.53, 0.38 under spot VIX (22.91) |
| Thu Nov 19 | Anthropic IPO trading debut (expected) | |
| Fri Nov 20 | SPX November monthly expiration | 23.2% ATM, about 217 pts; part of the −$48.8B weekly window |
| Wed Nov 25 | October PCE inflation (expected) | Nov 25 expiry 20.4% ATM |
| Thu Nov 26 / Fri Nov 27 | Thanksgiving (closed) / 1:00 pm early close |
What I'm watching
- 7,500. Now the weekly and monthly call wall and the second-largest negative strike (−$8.1B). The modeled profile goes from about −$87B at the close to −$55B at 7,500 and zero near 7,600, so a rebound would shed short gamma quickly.
- 7,400 and 7,300. The weekly and monthly put wall (7,400) and the largest negative strike (7,300, −$8.2B). The profile is about −$92B at 7,400 and −$111B at 7,300, so the curve flattens below spot rather than falling off a cliff.
- The Nov 17–20 expiries. Without them, modeled gamma at spot is about −$44B instead of −$87B. Even after Friday's monthly, the book stays well short at this price.
- The Nvidia premium. Nov 18 at 24.6% ATM vs 22.8% for Nov 17, about 163 points priced through Wednesday and about 217 through the Nov 20 monthly. Monday's expiry priced about 56 points and SPX moved 145.
- VIX futures backwardation. November (22.53) is above December (21.11) two sessions before Wednesday's expiration, VIX/VIX3M is 0.995 and VVIX 114.2. Whether December stays below spot after the roll will show if the market sees this as event risk or a new regime.
Sources
- The Motley Fool: Stock Market Today, Nov. 16: Tech Selloff Deepens as AI Leadership Crisis Rattles Nasdaq
- Vista Partners: Stock Market Today, November 16, 2026: Nasdaq Slides 2.49%
- Yahoo Finance (24/7 Wall St.): Nasdaq-100 Sinks as Nvidia Faces Its First Earnings Without Jensen Huang
- Investing.com: Fed minutes, Fedspeak and key data to watch this week
- Newsquawk: Week in Focus, 16–20 November 2026
- FXEmpire: The Week Ahead: Nvidia Earnings, Anthropic IPO Test AI Trade
- Investing.com: Earnings to watch: NVIDIA, Walmart, Home Depot and more report this week
- Newsquawk: Weekly US Earnings Estimates, 16–20 November 2026
- Macroption: VIX Expiration Calendar 2026
Volatility data: ilovevol.app. GEX assumes dealers are long calls and short puts. VIX futures use settlement prices. Implied moves are approximations from expiry ATM IV over the trading sessions to expiry. Vol Sentiment: ilovevol.app cross-asset score (0 = stress, 100 = calm), one-year window unless noted; day-over-day changes use the latest (revised) prior row. This issue uses the Nov 13 Vol Sentiment row, the latest available at publication.
This review is for informational and educational purposes only and is not investment advice. See the disclaimer.
The Daily Vol sends this review to your inbox each trading day: dealer gamma levels, the VIX curves, the SPX vol surface and the levels to watch. Free, one click to unsubscribe.