Home › Blog › Daily Market Review
Daily Market Review · US close
SPX slides 1% into Nvidia, dealer short gamma deepens to −$98.5B and VIX tops 25
SPX fell 1.03% to 7,341, 248 points under its 7,589 flip, and net GEX dropped to −$98.5B. VIX rose 2.55 to 25.46, VIX1D jumped 7.06 to 26.84, and the Nov 18 expiry priced 28.6% ATM vol before Nvidia's beat.
- Stocks fell for a second day ahead of Nvidia's results: SPX −1.03% to 7,341, NDX −0.72%, Dow −849 points, Russell 2000 −1.50%. Software led the losses. After the close Nvidia reported $115.8B of revenue against about $108.8B expected and guided above consensus; shares rose 1.3–1.7% after hours.
- Net GEX fell from −$91.1B to −$98.5B, and SPX is now 248 points under a 7,589 flip. The Nov 18–20 expiries hold about 43% of the modeled short gamma at spot.
- VIX rose 2.55 to 25.46 and VIX1D 7.06 to 26.84, now above every longer VIX index. November VIX futures (24.74) sit 8.3% over December (22.69) a session before expiry, and the Nov 18 SPX expiry priced 28.6% ATM, about 132 points, in a snapshot taken before Nvidia reported.
Scoreboard
| Close | Chg | Prev | |
|---|---|---|---|
| SPX | 7,341 | −1.03% | 7,417 |
| NDX | 27,002 | −0.72% | 27,197 |
| VIX | 25.46 | +2.55 | 22.91 |
| VIX1D | 26.84 | +7.06 | 19.78 |
| VVIX | 121.3 | +7.1 | 114.2 |
| VX Nov / Dec | 24.74 / 22.69 | −8.30% M1→M2 | −6.32% |
| VIX / VIX3M | 1.019 | +0.024 | 0.995 |
| 30D ATM IV / skew | 20.2% / 16.0 | +2.2 / +0.9 | 18.0% / 15.1 |
| Window | Net GEX | Chg | Prev | Flip | Call wall | Put wall | |
|---|---|---|---|---|---|---|---|
| SPX | All | −$98.5B | −$7.4B | −$91.1B | 7,589 | 8,000 | 7,000 |
| SPX | Weekly | −$49.9B | −$1.1B | −$48.8B | 7,615 | 7,500 | 7,300 |
| SPX | Monthly | −$69.0B | −$2.6B | −$66.4B | 7,614 | 7,500 | 7,300 |
| NDX | All | −$3.02B | +$0.27B | −$3.29B | 27,933 | 27,500 | 27,000 |
| NDX | Weekly | −$0.86B | +$0.29B | −$1.15B | 27,332 | 27,500 | 27,000 |
| NDX | Monthly | −$1.42B | +$0.19B | −$1.61B | 27,583 | 27,500 | 27,000 |
Dealer gamma by expiry window. All = every listed expiry; Weekly = contracts expiring within 7 calendar days; Monthly = within 30 days. Net GEX in $ per 1% move.
1. The tape: software sells off, Nvidia beats after the bell
The S&P 500 lost 76 points (1.03%) to 7,341, its fourth straight decline and its lowest close since July 29. The Nasdaq Composite fell 0.74% to 24,328, the Nasdaq-100 0.72% to 27,002, the Dow 849 points (1.6%) to about 50,759 and the Russell 2000 1.50% to 2,702. CNBC, cited by StockTitan, put decliners ahead of advancers by about three to one at midday, and the Nasdaq was down as much as about 2.1% intraday before recovering part of the drop.
Enterprise software took the heaviest hit: 24/7 Wall St. listed Salesforce (−9.6%), Intuit (−7.1%) and ServiceNow (−6.8%) among the day's biggest decliners, and Microsoft slipped about 2.3%. Chips were mixed, with Nvidia off 0.4% at $155.46 and Broadcom up 2.5%. Home Depot fell 2.4% after its report and a CEO change effective Nov 23, and Disney lost about 1.5% despite beating estimates and raising its dividend.
Data were mixed. October retail sales rose 0.2%, a touch above estimates, while industrial production fell 0.4% and import prices jumped 1.1%. The NAHB homebuilder index dropped 4 points to 25, its lowest since 2012, per Yahoo Finance. The 10-year Treasury yield stayed near 5.1%.
After the close, Nvidia reported fiscal third-quarter revenue of $115.8B against about $108.8B expected, EPS of $2.68 against $2.47, and fourth-quarter guidance of $127.4–132.6B against about $125.3B consensus, per CoinDesk. It was the first report since Jensen Huang stepped down as CEO; the chairman said the board does not plan to reinstate him. Shares rose 1.3% in early after-hours trading, per The Motley Fool, and were up about 1.7% later, per CoinDesk.
Why it matters for vol: all of the closing data on these pages, including the option chains, predate Nvidia's numbers. The surface paid up for the event right into the print: the first expiry after it, Nov 18, closed at 28.6% ATM. If the after-hours move holds near 1–2%, the market will have paid for more movement than it got, and some of Tuesday's front-end premium could come out on Wednesday.
2. Dealer gamma: deeper still, mostly from price
Net GEX across all expiries fell to −$98.5B per 1% move from −$91.1B. The flip slipped to 7,589 from 7,600, and SPX closed 248 points (3.4%) below it, against 184 points on Monday. Most of the change is the close moving further down the curve rather than new positioning: the weekly and monthly windows deepened only $1.1B and $2.6B.
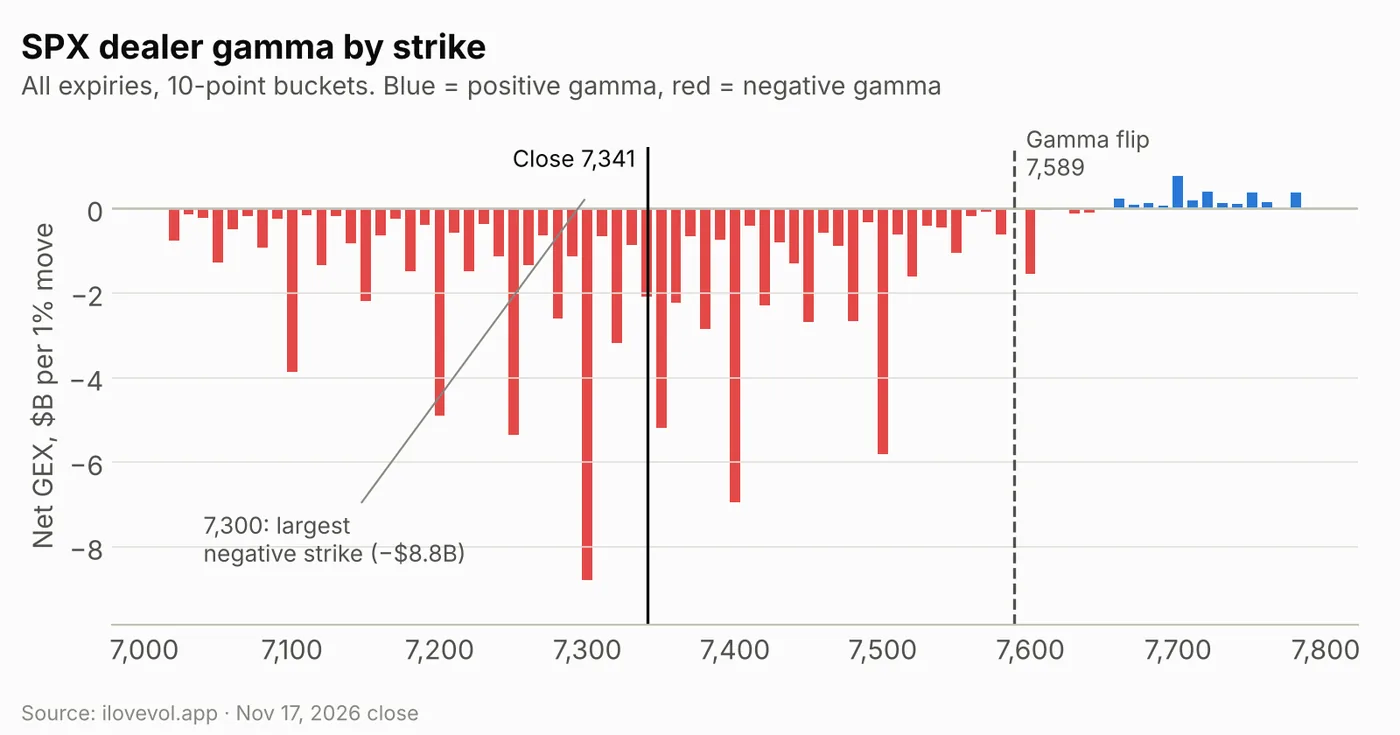
Every bucket from 7,000 to 7,610 is negative; the first positive bucket above spot is 7,620. The largest negative strikes are 7,300 (−$8.8B), 7,400 (−$7.0B), 7,500 (−$5.8B), 7,250 (−$5.4B) and 7,350 (−$5.2B). The positive side is thin, led by 7,700 at only +$0.8B.
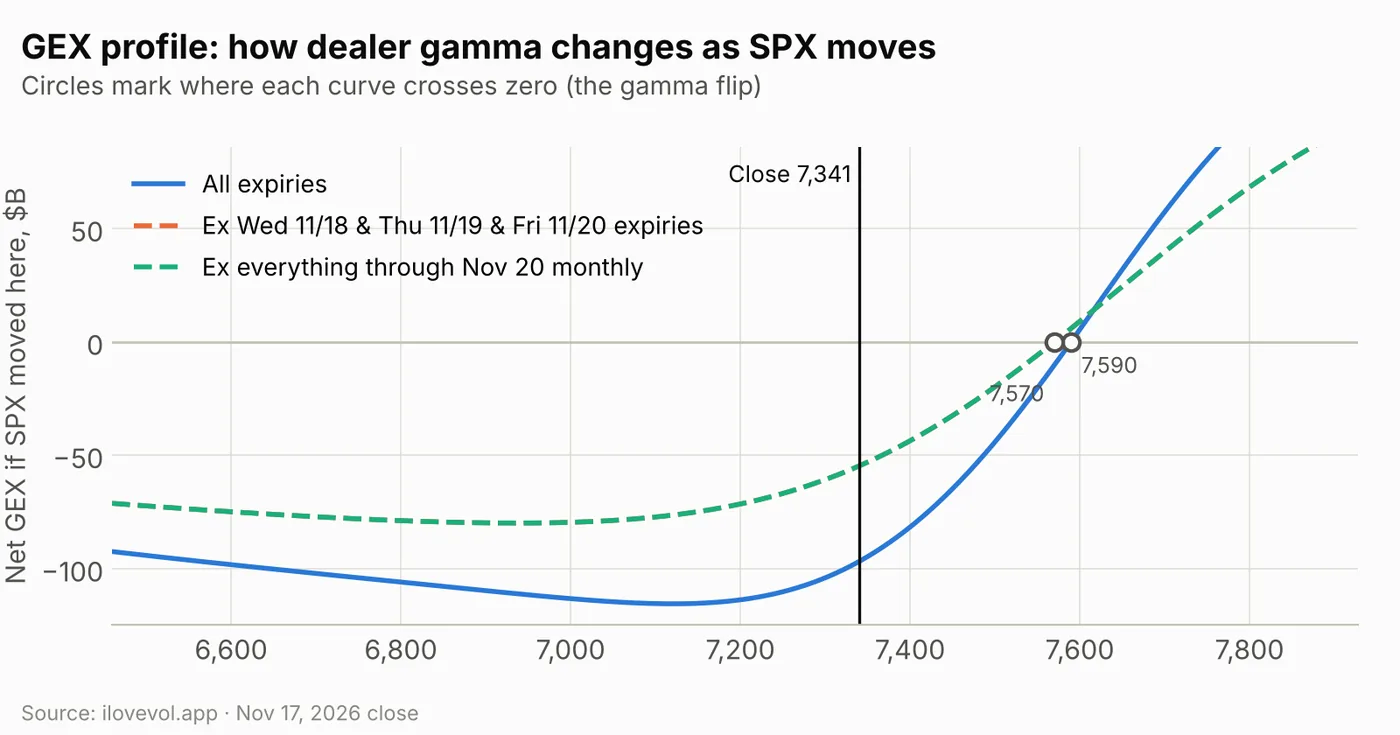
The modeled profile reads about −$97B at the close and crosses zero near 7,590. Above spot it climbs steeply: about −$82B at 7,400, −$44B at 7,500 and −$20B at 7,550. Below spot it flattens: −$104B at 7,300, −$114B at 7,200 and a floor of about −$116B near 7,120. A rebound would shed short gamma much faster than a further drop would add it.
This week's expiries carry about 43% of it. The two dashed curves coincide again, because removing the Nov 18–20 expiries is the same as removing everything through the Nov 20 monthly. Without them, modeled gamma at spot is about −$55B instead of −$97B, and the flip is near 7,570. The rest sits mostly in December and later, so the book stays short at this price after Friday.
Weekly vs monthly: the put walls step down to 7,300
The three SPX flips sit within 26 points of each other, 248–274 points above the close: all-expiry 7,589, monthly 7,614 and weekly 7,615 (numbers in the dealer-gamma table under the scoreboard). The weekly and monthly call walls stayed at 7,500, while both put walls moved down to 7,300 from 7,400. The close sits inside that 200-point band, 41 points above the put walls.
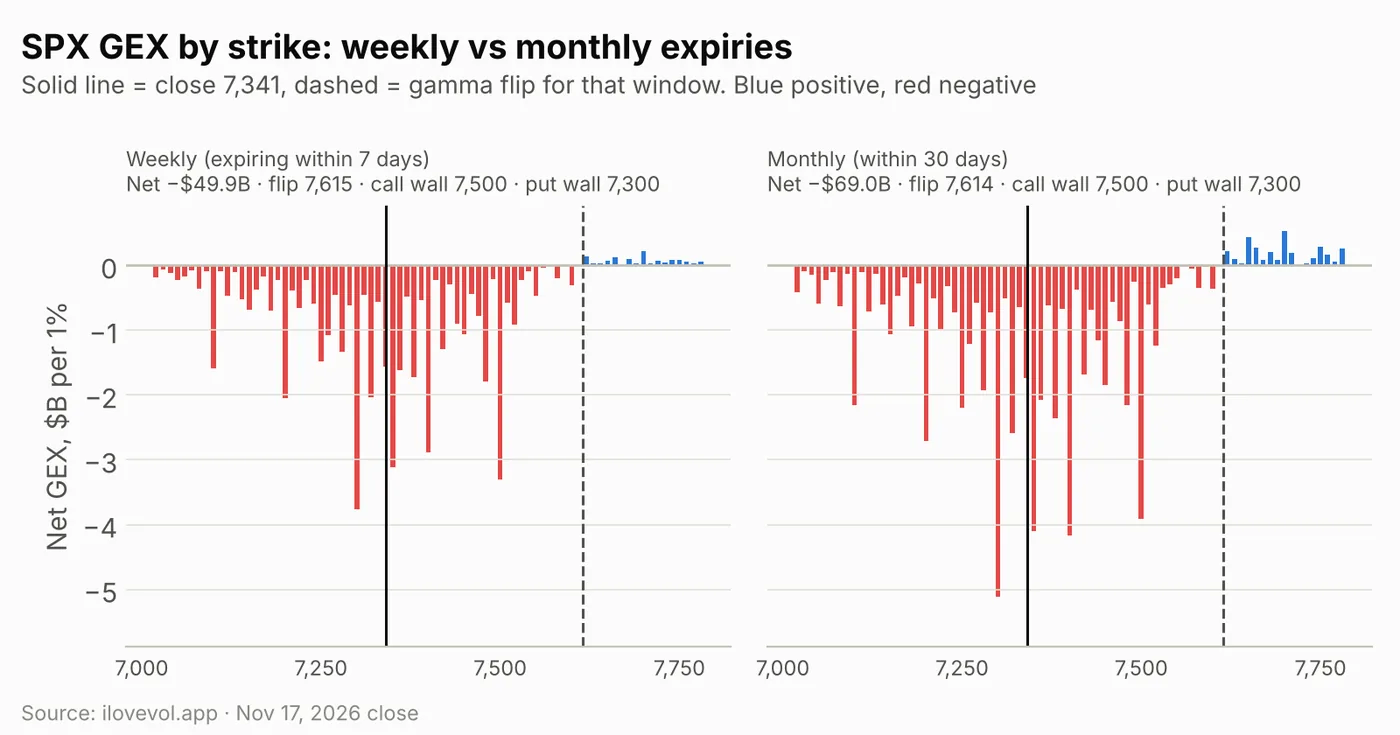
SPX weekly: the next 7 days hold −$49.9B across five expiries from Nov 18 to Nov 24, about 51% of the all-expiry total. The flip is 7,615, the call wall 7,500 and the put wall 7,300. The largest weekly buckets are 7,300 (−$3.8B), 7,500 (−$3.3B), 7,350 (−$3.1B) and 7,400 (−$2.9B); the largest positive one is just 7,700 (+$0.2B).
SPX monthly: the 30-day window is −$69.0B (flip 7,614, call wall 7,500, put wall 7,300), with its largest buckets at 7,300 (−$5.1B), 7,400 (−$4.2B), 7,350 (−$4.1B) and 7,500 (−$3.9B). That leaves about −$19.1B in expiries 8–30 days out. Everything beyond 30 days nets to about −$29.5B, against −$24.7B on Monday, so the longer-dated book keeps adding to the short gamma rather than offsetting it.
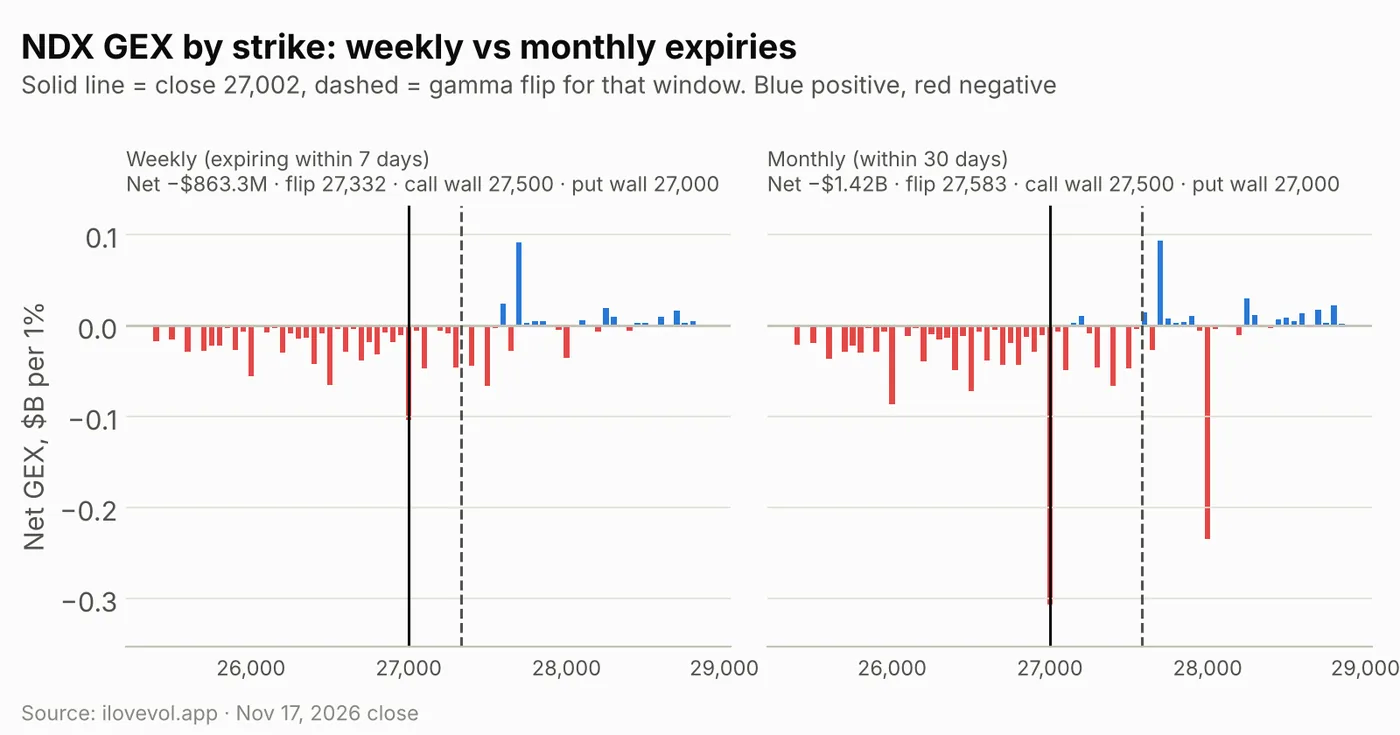
NDX fell 0.72% to 27,002, but its short gamma eased slightly to −$3.02B from −$3.29B. It is 931 points under its 27,933 all-expiry flip, 330 points under the weekly flip (27,332) and 581 under the monthly flip (27,583). Both windows share a 27,500 call wall and a 27,000 put wall, so the index closed right on its put wall. The weekly window is −$0.86B and the monthly −$1.42B, whose largest buckets are 27,000 (−$0.31B) and 28,000 (−$0.23B); about −$1.6B sits beyond 30 days.
RUT fell 1.50% to 2,702 and its short gamma deepened to −$3.59B from −$2.75B, 124 points under its 2,826 flip, with the call wall at 2,765 and the put wall at 2,700, two points below the close.
3. The VIX complex: the front end leads, the curve inverts
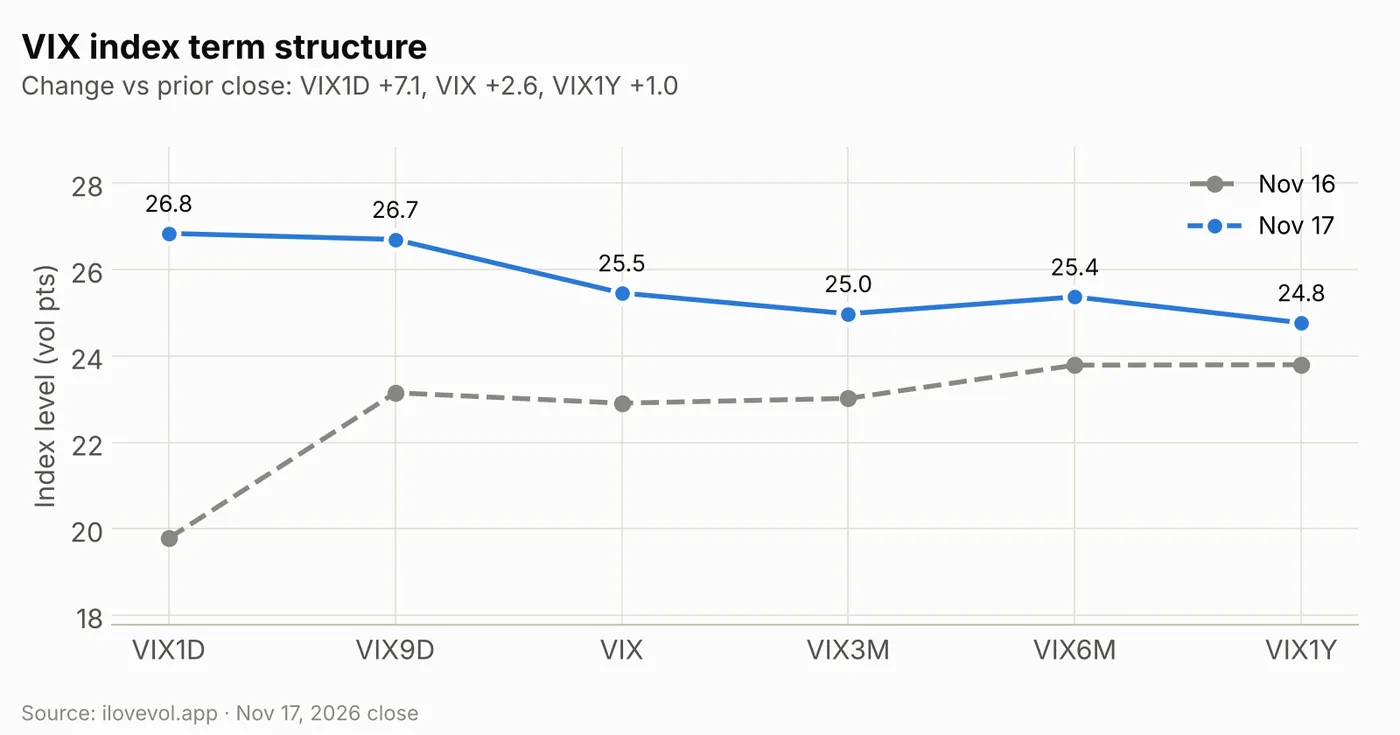
VIX1D jumped 7.06 to 26.84 as Wednesday's session became the Nvidia reaction day, and it now sits above VIX9D (26.70, +3.55), VIX (25.46, +2.55) and VIX3M (24.98, +1.96). VIX6M rose 1.58 to 25.37 and VIX1Y 0.97 to 24.77. The index curve is inverted from one day to three months, with a small bump at six months.
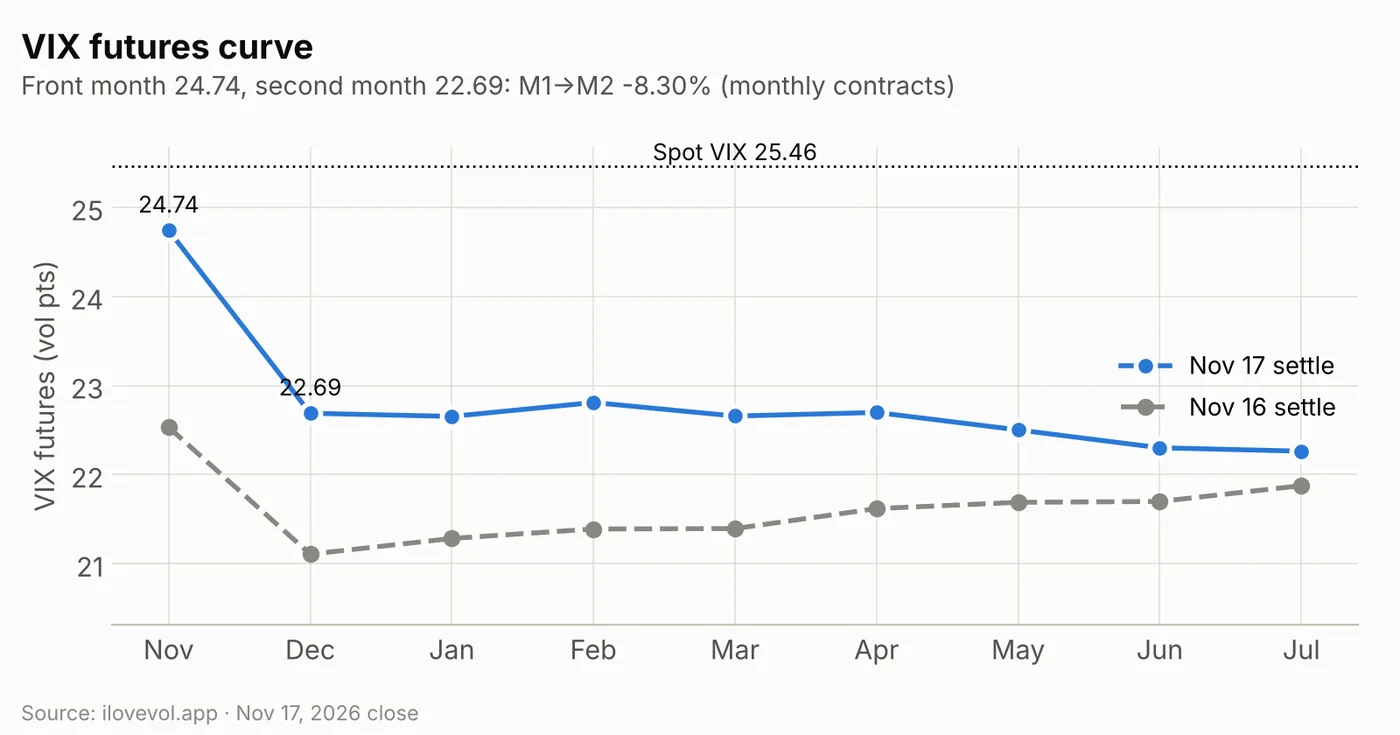
November futures settled at 24.74, up 2.21, and December at 22.69, up 1.58. January rose 1.37 to 22.65 and July 0.39 to 22.26. The front kink widened: M1→M2 is −8.30% from −6.32%. Unlike Monday, the back of the curve now slopes slightly down too, from 22.81 in February to 22.26 in July, so the whole curve sits below spot VIX. November expires on Wednesday morning's settlement and closed 0.72 under spot. After the roll, December becomes the front month, 2.77 points under spot. VVIX rose 7.1 to 121.3.
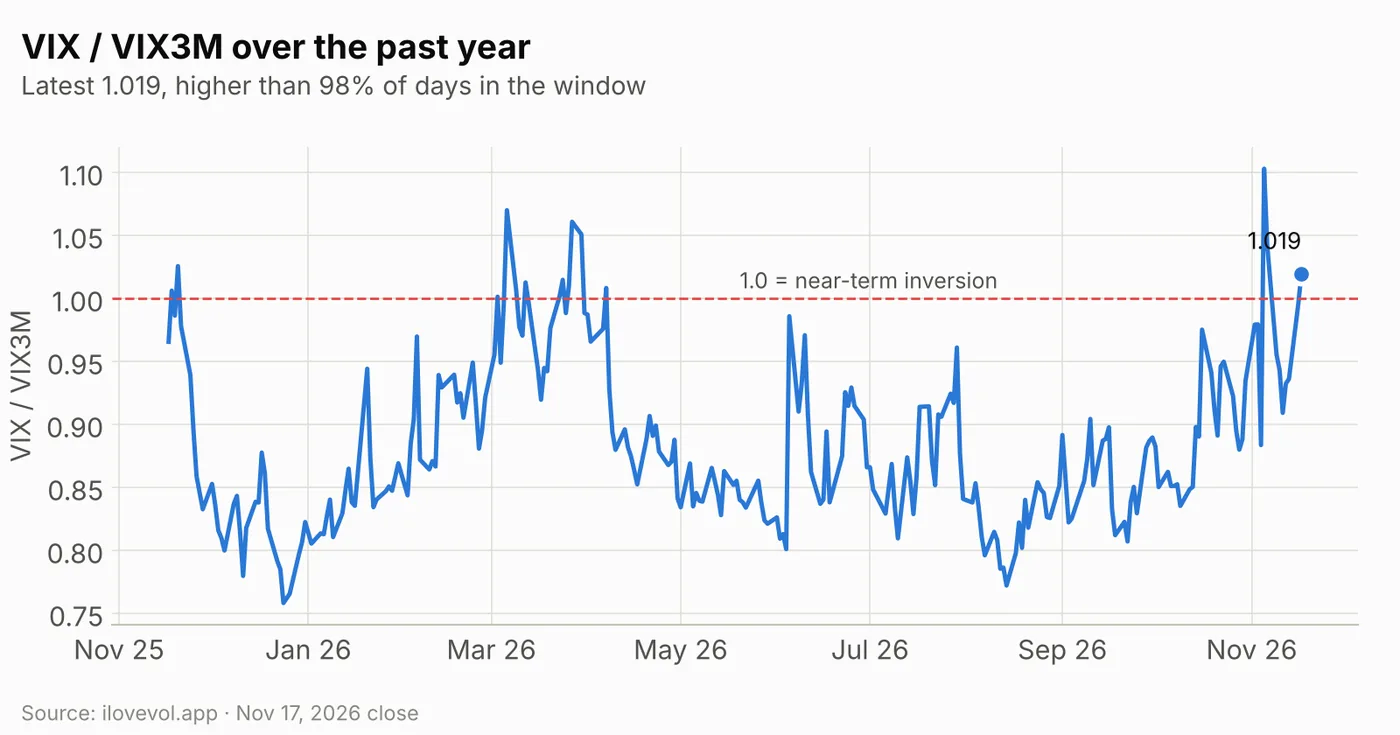
VIX/VIX3M rose to 1.019 from 0.995, back above the 1.0 inversion line for the first time since the Nov 5–6 spike to 1.103. It is higher than 98% of the past year's sessions.
4. Implied vs realized: the premium rebuilds a little
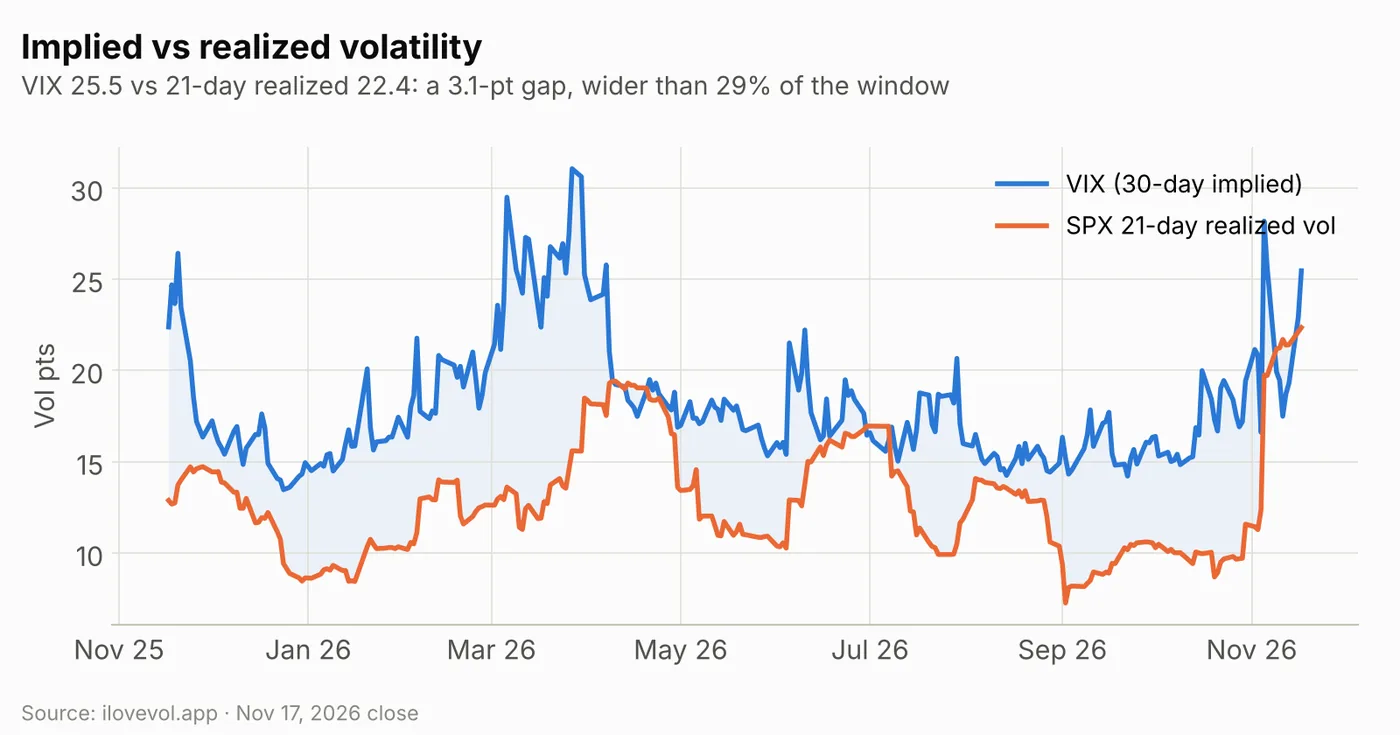
SPX 21-day realized vol edged up to 22.4 from 22.1. With VIX at 25.5, the gap widened to +3.1 points from +0.8, but that is still wider than only 29% of the past year. Thirty-day ATM IV (20.2%) remains about 2 points under realized, so most of VIX's premium comes from the put wing rather than at-the-money vol.
5. SPX surface: the event week is priced near 29%
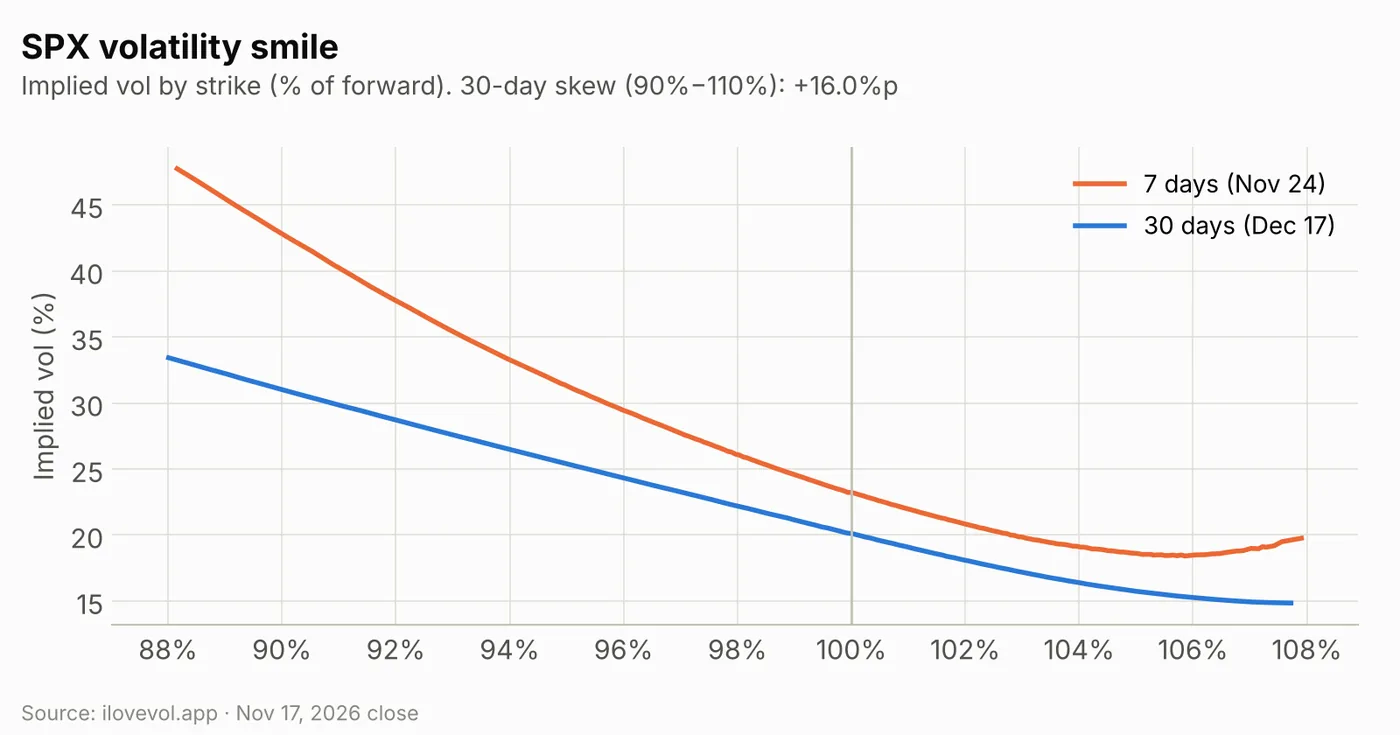
Thirty-day ATM IV rose to 20.2% from 18.0%, and 30-day skew (90% vs 110%) steepened to 16.0 points from 15.1. The 90-day minus 30-day slope deepened to −1.7 points from −1.0. The 7-day smile (Nov 24) runs from about 48% at 88% of the forward to about 23% at the money, bottoms near 18% around 106% and curls up to about 20% at 108%. The 30-day curve (Dec 17) runs from about 34% to about 15%.
The expiry table shows the event premium. Nov 18, the first expiry after Nvidia, closed at 28.6% ATM (24.6% on Monday), about 132 points for one session. Nov 19 is 29.1%, about 190 points through Thursday, and the Nov 20 monthly 26.8% (23.2% Monday), about 215 points through Friday. After that the curve eases: 23.2–23.3% for Nov 23–25, 22.0% for the Nov 27 half-day and 20.6% for Nov 30. Skew is steepest at the front, about 24.6 points for Nov 18.
6. Cross-asset Vol Sentiment: US equities hit the stressed end
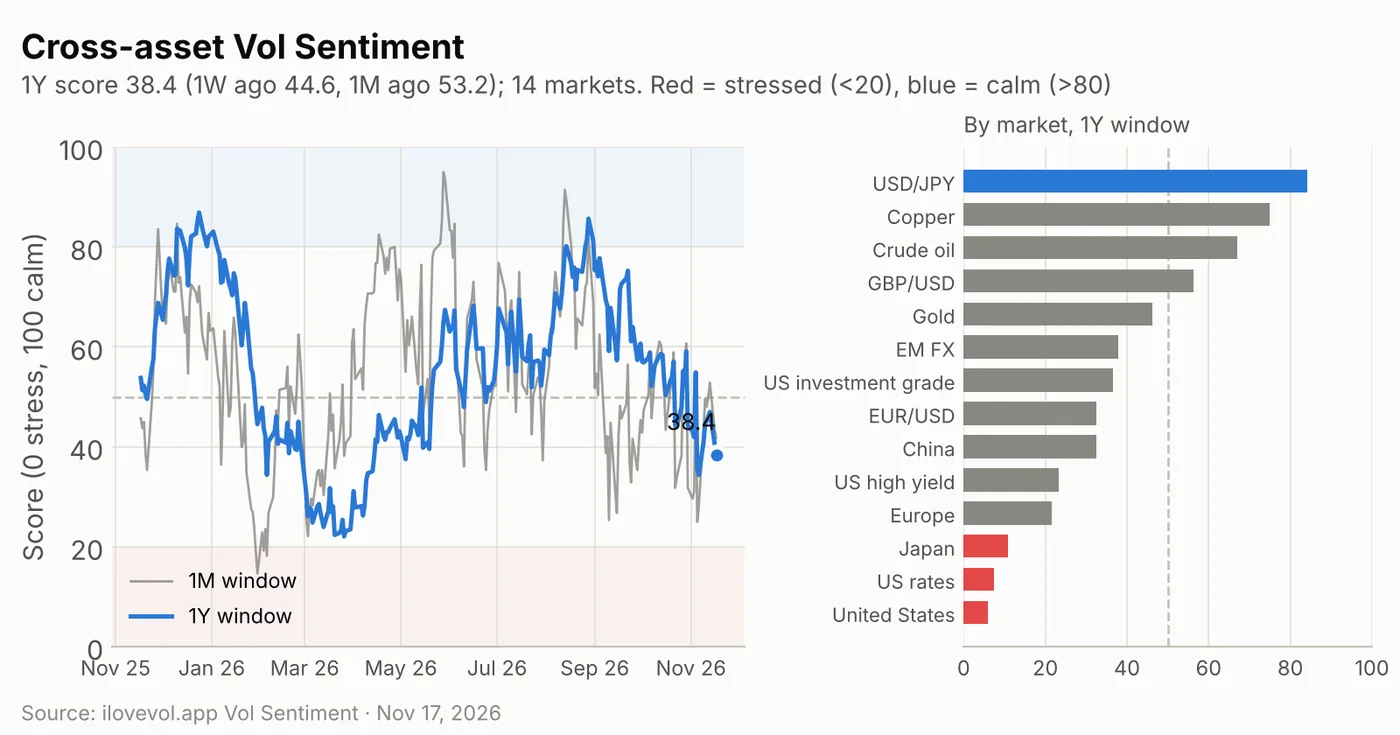
The cross-asset Vol Sentiment score places volatility in 14 equity, currency, rates, credit and commodity markets within its own one-year range (0 = stress, 100 = calm). On the one-year window it fell to 38.4 from 40.7 on Monday, below the 50 midpoint and down from 44.6 a week ago and 53.2 a month ago. It is higher than only 14% of the past year's sessions. The one-month score is 41.8 and the three-month score 27.9.
Three markets are now in the stressed zone below 20: US equities (5.8), US rates (7.5) and Japan (10.8). Europe (21.7) and US high yield (23.3) are close behind. USD/JPY (84.2) is the only calm market, followed by copper (75.0) and crude oil (67.1). The US equities score uses the VIX, so it confirms what the SPX surface shows; the added information is that rates vol sits at the same stressed end and Japanese and European equity vol are not far off. It is context, not a trading signal.
Calendar: the week ahead
Economic data & Fed
| Date | Time (ET) | Event | Note |
|---|---|---|---|
| Wed Nov 18 | 8:30 | Housing starts and permits (Oct) | 20-year bond auction 13:00; Barr 13:35 |
| Wed Nov 18 | 14:00 | FOMC minutes (Oct 27–28 meeting) | Rates held at 3.75–4.00% with two dissents; Kashkari 16:15 |
| Thu Nov 19 | 8:30 | Jobless claims, Philadelphia Fed survey (Nov) | Goolsbee 12:30, Barkin 16:00 (expected) |
| Fri Nov 20 | 10:00 | University of Michigan sentiment (Nov, final) | Waller 8:25, Cook 12:15 |
| Wed Nov 25 | – (expected) | October PCE inflation | Nov 25 expiry 23.3% ATM |
Earnings
| Date | Timing | Companies | Note |
|---|---|---|---|
| Wed Nov 18 | Before open | Target, Lowe's, TJX | Nvidia reaction day; Nov 18 expiry 28.6% ATM |
| Wed Nov 18 | After close | Palo Alto Networks | Software already under pressure |
| Thu Nov 19 | Before open | Walmart, PDD Holdings | Nov 19 expiry 29.1% ATM |
| Thu Nov 19 | After close | Intuit, Ross Stores, Keysight, Gap | Intuit fell 7.1% Tuesday |
Volatility dates (expirations, events)
| Date | Event | Note |
|---|---|---|
| Wed Nov 18 | VIX November futures and options expiration | Nov future 24.74, 0.72 under spot VIX (25.46) |
| Wed Nov 18 | First SPX expiry after Nvidia | 28.6% ATM, about 132 pts; VIX1D 26.84 |
| Thu Nov 19 | Anthropic IPO trading debut (expected) | |
| Fri Nov 20 | SPX November monthly expiration | 26.8% ATM, about 215 pts through Friday |
| Thu Nov 26 / Fri Nov 27 | Thanksgiving (closed) / 1:00 pm early close | Nov 27 expiry 22.0% ATM |
| Wed Dec 16 | VIX December expiration | Dec future 22.69 |
| Fri Dec 18 | SPX December quarterly expiration | 20.0% ATM |
What I'm watching
- 7,500, then 7,590–7,615. The weekly and monthly call wall (7,500), then the all-expiry, monthly and weekly flips. The modeled profile goes from about −$97B at the close to −$44B at 7,500 and zero near 7,590, so a post-Nvidia rebound would shed short gamma quickly.
- 7,300. The new weekly and monthly put wall and the largest negative strike (−$8.8B). The profile is about −$104B there and bottoms near −$116B around 7,120, so the curve flattens below spot rather than steepening.
- The Nvidia premium vs the after-hours move. The Nov 18 expiry closed at 28.6% ATM (about 132 points) and VIX1D at 26.84, both set before the beat. Shares were up 1.3–1.7% after hours. A modest reaction would leave much of that premium unearned.
- Wednesday's VIX settlement. November (24.74) is 8.3% over December (22.69), VIX/VIX3M is 1.019 and VVIX 121.3. After the roll, December is the front month at 2.77 under spot; whether spot VIX falls toward it will show how much of the inversion was event premium.
- Friday's roll-off. Removing the Nov 18–20 expiries cuts modeled gamma at spot from about −$97B to −$55B. The Nov 20 monthly prices 26.8% ATM, about 215 points through Friday.
Sources
- The Motley Fool: Stock Market Today, Nov. 17: Nvidia Slides Ahead of Earnings but Soars in After Hours Trading
- StockTitan: Stock Market Today, November 17, 2026: Stocks Fall Before Nvidia's Results
- 24/7 Wall St.: S&P 500 Closes Down 1% as the Dow Sheds 955 Points
- Yahoo Finance: Stock market today: Dow, S&P 500, Nasdaq losses pick up in countdown to Nvidia earnings
- CoinDesk: Nvidia tops estimates, issues strong guidance; shares rise
- Newsquawk: Weekly Economic Release, 16–20 November 2026
- Investing.com: Fed minutes, Fedspeak and key data to watch this week
- Investing.com: Earnings to watch: NVIDIA, Walmart, Home Depot and more report this week
- ThriveInMarkets: Economic Calendar, Nov 16–20, 2026
- Macroption: VIX Expiration Calendar 2026
Volatility data: ilovevol.app. GEX assumes dealers are long calls and short puts. VIX futures use settlement prices. Option data are the post-close snapshot (4:15 pm ET), taken before Nvidia's results. Implied moves are approximations from expiry ATM IV over the trading sessions to expiry. Vol Sentiment: ilovevol.app cross-asset score (0 = stress, 100 = calm), one-year window unless noted; day-over-day changes use the latest (revised) prior row.
This review is for informational and educational purposes only and is not investment advice. See the disclaimer.
The Daily Vol sends this review to your inbox each trading day: dealer gamma levels, the VIX curves, the SPX vol surface and the levels to watch. Free, one click to unsubscribe.