Home › Blog › Daily Market Review
Daily Market Review · US close
SPX falls 2% for a sixth straight loss as VIX hits 28.4, its highest close since March
SPX dropped 2.02% to 7,176, 325 points under its 7,501 gamma flip, with net GEX at −$87.0B. VIX rose 3.88 to 28.44, VIX1D 8.81 to 32.06, and VIX/VIX3M climbed to 1.052. Levels for Friday's monthly expiry inside.
- Anthropic's debut faded from its open, chips sold off and hawkish Fed pricing stayed in place: SPX −2.02% to 7,176, a sixth straight loss and 5.8% below the Nov 11 close; the Dow lost 1,101 points and NDX 2.21%.
- Net GEX is −$87.0B (−$97.5B Wednesday). SPX closed 325 points under a 7,501 flip. The profile stays near −$95B all the way down to about 6,700, so short gamma does not fade on further declines.
- Wednesday's surface priced about a 1.1% move for Thursday and SPX moved 2.0%. VIX rose 3.88 to 28.44, higher than 99% of the past year, VIX1D jumped 8.81 to 32.06, and the VIX futures curve flipped into backwardation (M1→M2 −2.23%).
Scoreboard
| Close | Chg | Prev | |
|---|---|---|---|
| SPX | 7,176 | −2.02% | 7,324 |
| NDX | 26,517 | −2.21% | 27,116 |
| VIX | 28.44 | +3.88 | 24.56 |
| VIX1D | 32.06 | +8.81 | 23.25 |
| VVIX | 127.1 | +8.7 | 118.4 |
| VX Dec / Jan | 24.54 / 23.99 | −2.23% M1→M2 | +0.27% |
| VIX / VIX3M | 1.052 | +0.041 | 1.011 |
| 30D ATM IV / skew | 22.8% / 16.9 | +3.0 / +0.8 | 19.8% / 16.0 |
| Window | Net GEX | Chg | Prev | Flip | Call wall | Put wall | |
|---|---|---|---|---|---|---|---|
| SPX | All | −$87.0B | +$10.5B | −$97.5B | 7,501 | 8,000 | 7,000 |
| SPX | Weekly | −$24.1B | +$22.3B | −$46.4B | 7,480 | – | – |
| SPX | Monthly | −$64.4B | +$16.3B | −$80.8B | 7,518 | 7,700 | 7,000 |
| NDX | All | −$2.83B | +$0.04B | −$2.86B | 28,443 | 29,000 | 26,000 |
| NDX | Weekly | −$0.43B | +$0.30B | −$0.74B | 27,521 | – | – |
| NDX | Monthly | −$2.30B | +$0.15B | −$2.45B | 28,752 | 29,000 | 26,000 |
Dealer gamma by expiry window. All = every listed expiry; Weekly = contracts expiring within 7 calendar days; Monthly = within 30 days. Net GEX in $ per 1% move. From the site's stored end-of-day GEX history (Prev = its Nov 18 row); the stored history has no weekly walls.
1. The tape: Anthropic fades, chips slide, a sixth straight loss
The S&P 500 fell 147.80 points (2.02%) to 7,176, its sixth straight decline per The Motley Fool, and is now 5.8% below its Nov 11 close. The Dow lost 1,101 points (2.19%) to 49,097 and the Nasdaq Composite 2.25% to 23,879, per Yahoo Finance. The Nasdaq-100 fell 2.21% to 26,517 and the Russell 2000 2.18% to 2,655. Stocks opened higher and sold off into the close, with nearly every sector lower; industrials fell 2.6%, while energy and staples finished roughly flat.
Anthropic's Nasdaq debut set the tone. Yahoo Finance reported the IPO raised a record $81.3B at $83 a share; the stock opened at $111.50, slipped to about $97 within half an hour and closed at $97.17, up 17% on the offer price but well off the open. Yahoo noted that index selling picked up as the stock faded. Chips were the other weight: AMD fell 7.7% after a short-seller report, Nvidia 3.3% to $145.98 as investors weighed its CEO transition after strong results, and Broadcom 2.1%. Amazon (−3.9%), Meta (−3.3%) and Alphabet (−2.9%) also fell. Insmed jumped 20.6% on takeover reports and Palo Alto Networks rose 6.4% after earnings.
Macro data did not help. Initial jobless claims rose to 203,000, above forecasts near 197,000, and continuing claims climbed 70,000 to 1.763 million. The Philadelphia Fed index fell to 6.3 from 20.9, far below expectations around 20, while its prices-paid gauge jumped to 58.2. After Wednesday's minutes showed nearly all officials expecting further hikes, TipRanks, citing CME FedWatch, put the odds of a quarter-point hike on Dec 9 near 90%. The 10-year yield held near 5.05%, and gold fell about 2%.
Why it matters for vol: Wednesday's surface priced roughly a 1.1% move for Thursday, and SPX delivered 2.0% with the index sitting deep in negative gamma. That realized move came on top of a sixth losing day, so the front end repriced: VIX1D now sits above VIX, and the front of the VIX futures curve slopes down again.
2. Dealer gamma: deeper below the flip, but a smaller book
Net GEX across all expiries is −$87.0B per 1% move, from −$97.5B on Wednesday's stored row. The flip fell to 7,501 from 7,564, but SPX fell further, so the index closes 325 points (4.5%) below it, against 241 points on Wednesday. Part of the smaller total is a bookkeeping effect: the stored history drops the AM-settled November monthly after its last trading day (Thursday). Those contracts still settle at Friday's open, and on the live chain they carried about −$21.7B, which would put the all-expiry total near −$109B.
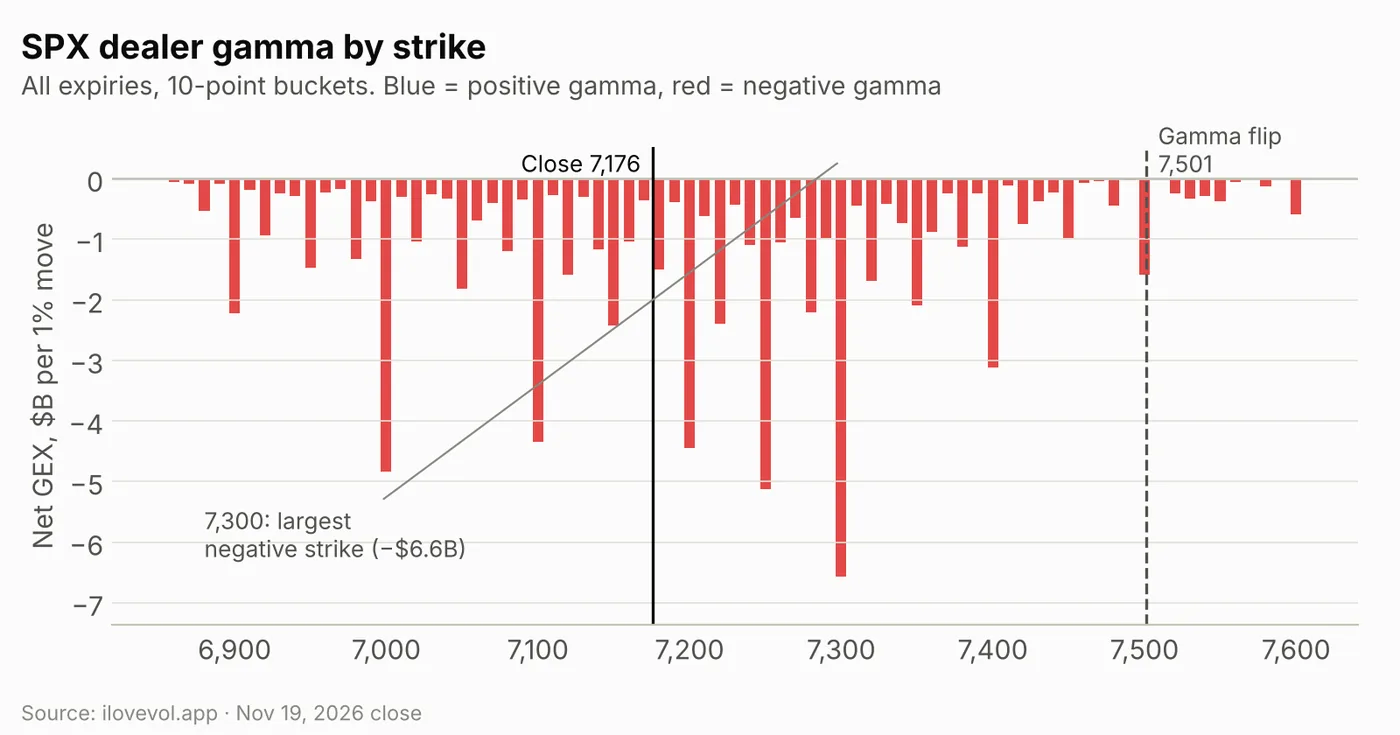
Every 10-point bucket within 6% of spot is negative or close to zero; the largest positive bucket, 7,590, is just +$0.02B. The largest negative strikes are 7,300 (−$6.6B), 7,250 (−$5.1B), 7,000 (−$4.8B), 7,200 (−$4.4B) and 7,100 (−$4.4B). The close sits between 7,100 and 7,200, with 7,000 the next large strike below.
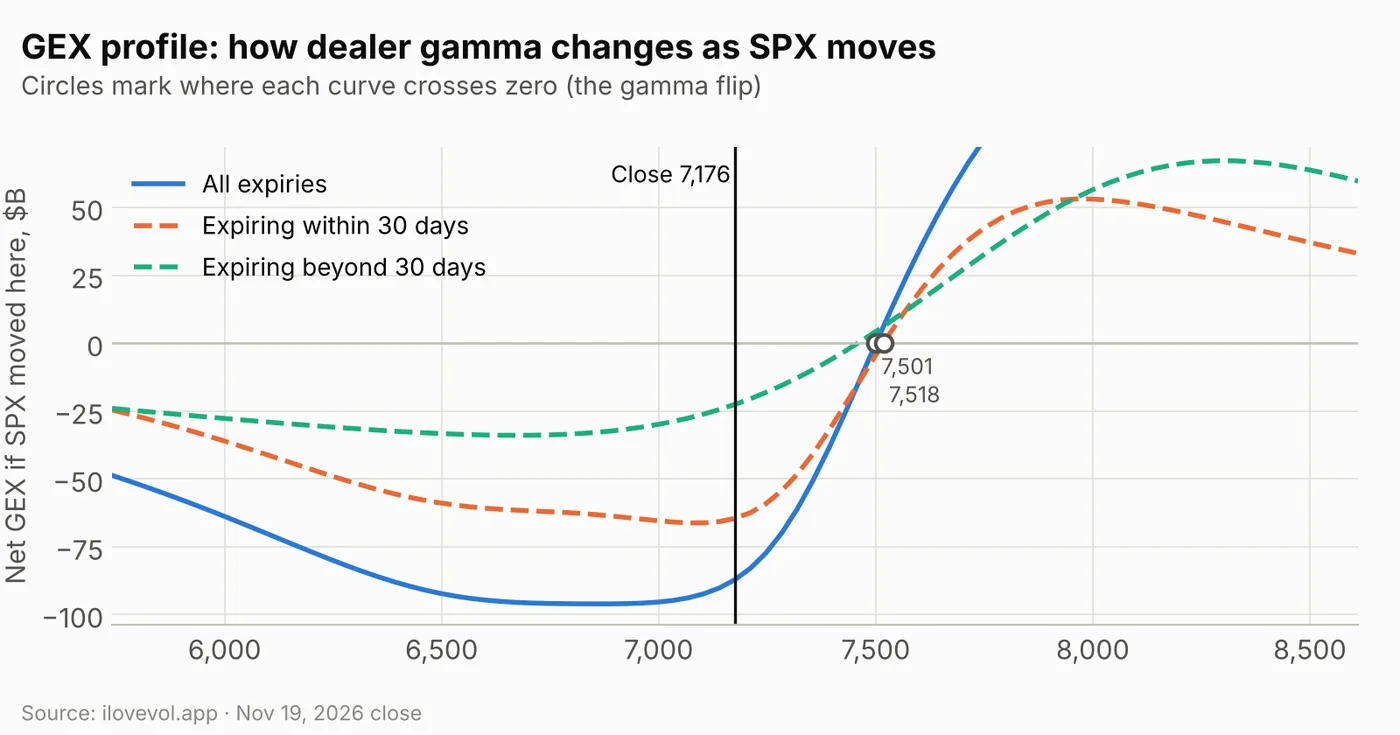
The modeled profile reads about −$87B at the close and crosses zero near 7,500. Above spot it climbs fast: about −$61B at 7,320, −$39B at 7,390 and −$14B at 7,460. Below spot it barely moves: −$92B at 7,100, −$95B at 7,030 and a floor near −$96B between 6,700 and 6,900. A rebound would shed short gamma quickly; a further decline keeps it roughly constant rather than making it worse.
Expiries within 30 days account for about −$64.6B of the gamma at spot and those beyond 30 days for about −$22.6B. Both curves cross zero close to the all-expiry flip (7,518 for the 30-day window, about 7,459 beyond it), so the longer-dated book adds to the short gamma at this price rather than offsetting it.
Weekly vs monthly: the near week gets lighter
The three SPX flips sit within 38 points of each other, 304–343 points above the close: weekly 7,480, all-expiry 7,501 and monthly 7,518 (numbers in the dealer-gamma table under the scoreboard). The monthly call wall moved up to 7,700 from 7,400; the monthly and all-expiry put walls stay at 7,000, 176 points under the close.
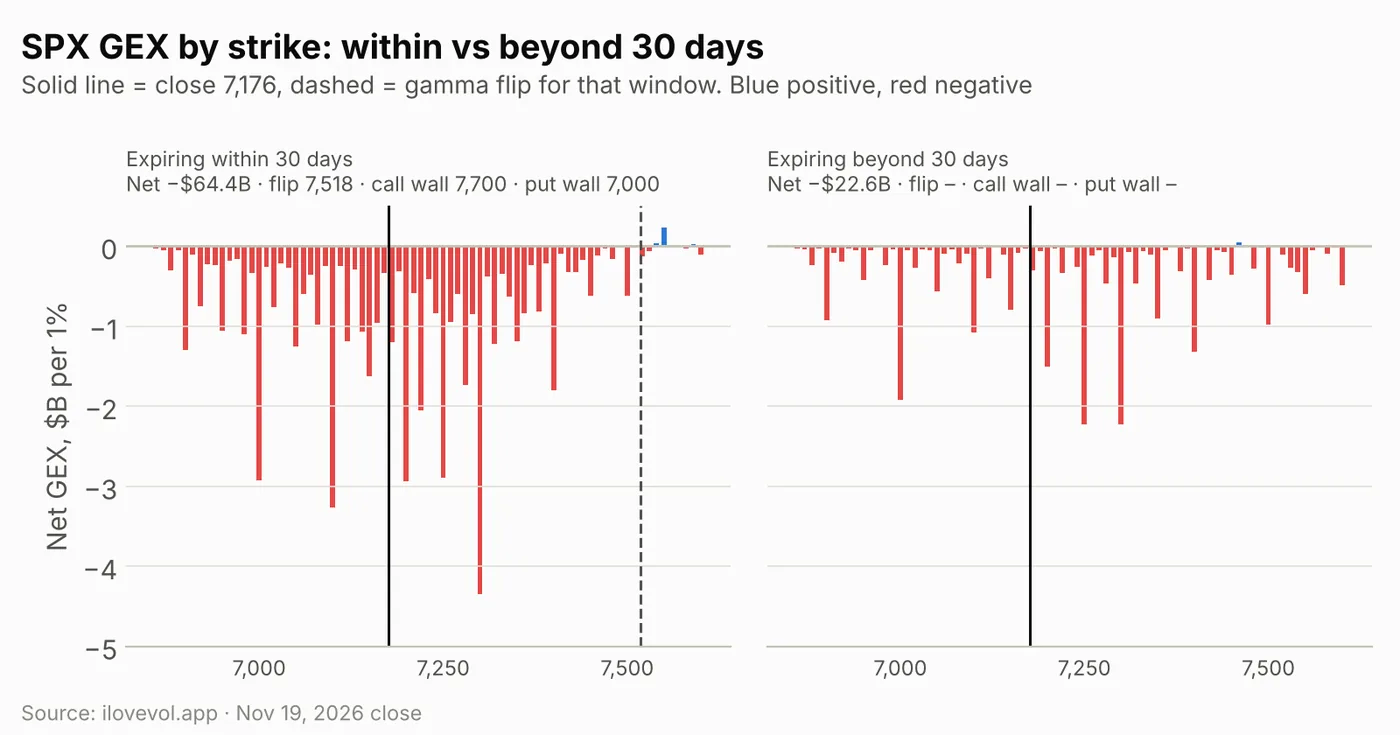
SPX weekly: the next 7 days hold −$24.1B, about 28% of the stored total and $22.3B less negative than Wednesday. Most of that drop is the calendar: the Nov 19 expiry rolled off and the stored data no longer counts the AM-settled monthly. Friday's PM-settled expiry and next week's three expiries remain; on the live chain the PM Nov 20 expiry alone carried about −$14.9B. The stored history has no weekly strike table, so the chart splits the book at 30 days instead.
SPX monthly: the 30-day window is −$64.4B (from −$80.8B), with flip 7,518, call wall 7,700 and put wall 7,000. Its largest buckets are 7,300 (−$4.4B), 7,100 (−$3.3B), 7,200 (−$2.9B) and 7,000 (−$2.9B). Beyond 30 days the book is another −$22.6B, led by 7,250 (−$2.2B), 7,300 (−$2.2B) and 7,000 (−$1.9B).
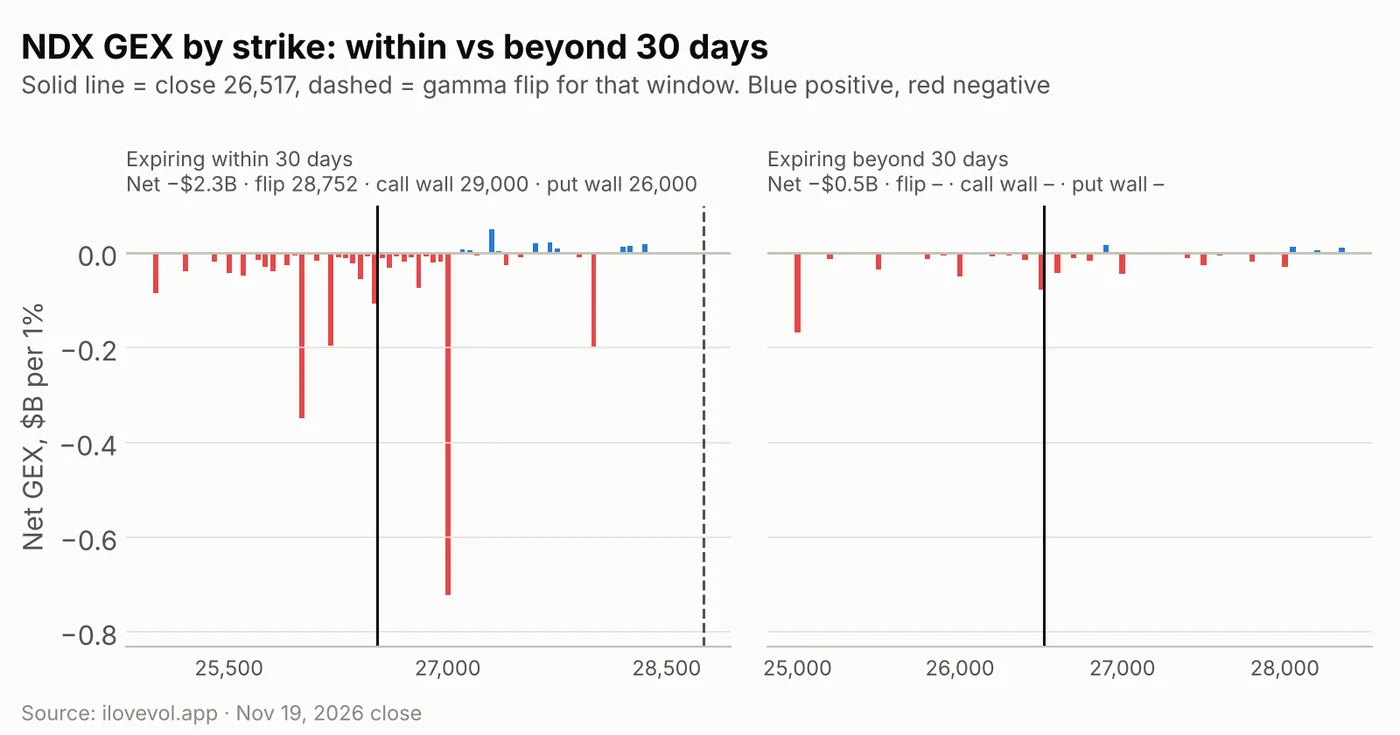
NDX fell 2.21% to 26,517 and its short gamma was little changed at −$2.83B (−$2.86B Wednesday). It now sits 1,926 points under its 28,443 all-expiry flip, 1,004 under the weekly flip (27,521) and 2,235 under the monthly flip (28,752). The call wall moved to 29,000 and the put wall to 26,000, 517 points under the close. The weekly window is −$0.43B and the 30-day window −$2.30B, led by the 27,000 bucket (−$0.72B) and 26,000 (−$0.35B).
RUT fell 2.18% to 2,655, and its short gamma eased to −$3.13B from −$3.66B. It sits 200 points under its 2,855 flip, with the call wall at 2,800 and the put wall at 2,650, just 5 points below the close.
3. The VIX complex: the front end takes over
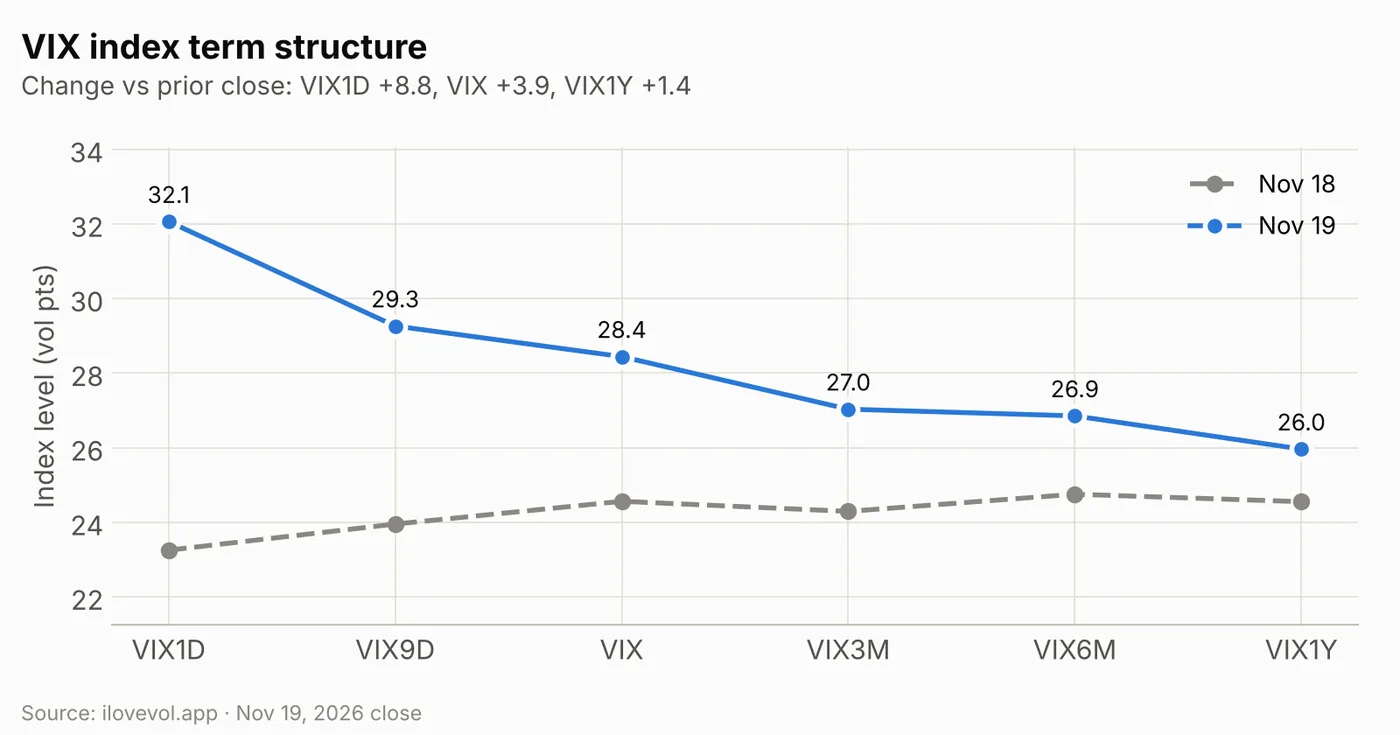
The whole index curve shifted up and inverted. VIX1D jumped 8.81 to 32.06 and VIX9D 5.31 to 29.26, while VIX rose 3.88 to 28.44, VIX3M 2.74 to 27.03, VIX6M 2.10 to 26.85 and VIX1Y 1.41 to 25.96. The curve now slopes down from one day to one year. VIX's close is its highest since March 30 and above 99% of the past year's sessions; VVIX rose 8.7 to 127.1.
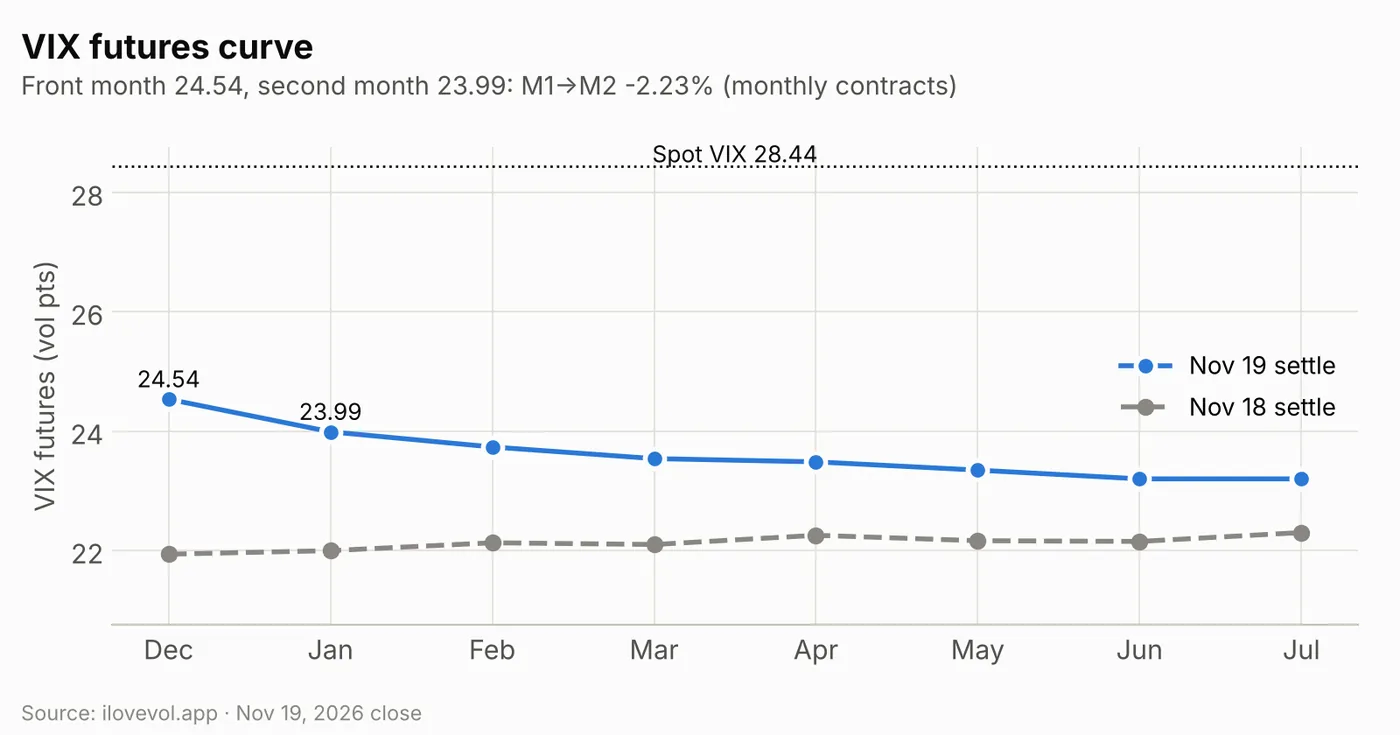
December VIX futures settled at 24.54, up 2.60, and January at 23.99, up 1.99, putting M1→M2 at −2.23%, backwardation, against +0.27% contango on Wednesday. Every listed month rose, by 0.9 to 2.6 points, with the largest gains at the front. The futures still sit 3.9–5.2 points under spot VIX, so the market continues to expect today's level to come down, but less firmly than a day ago.
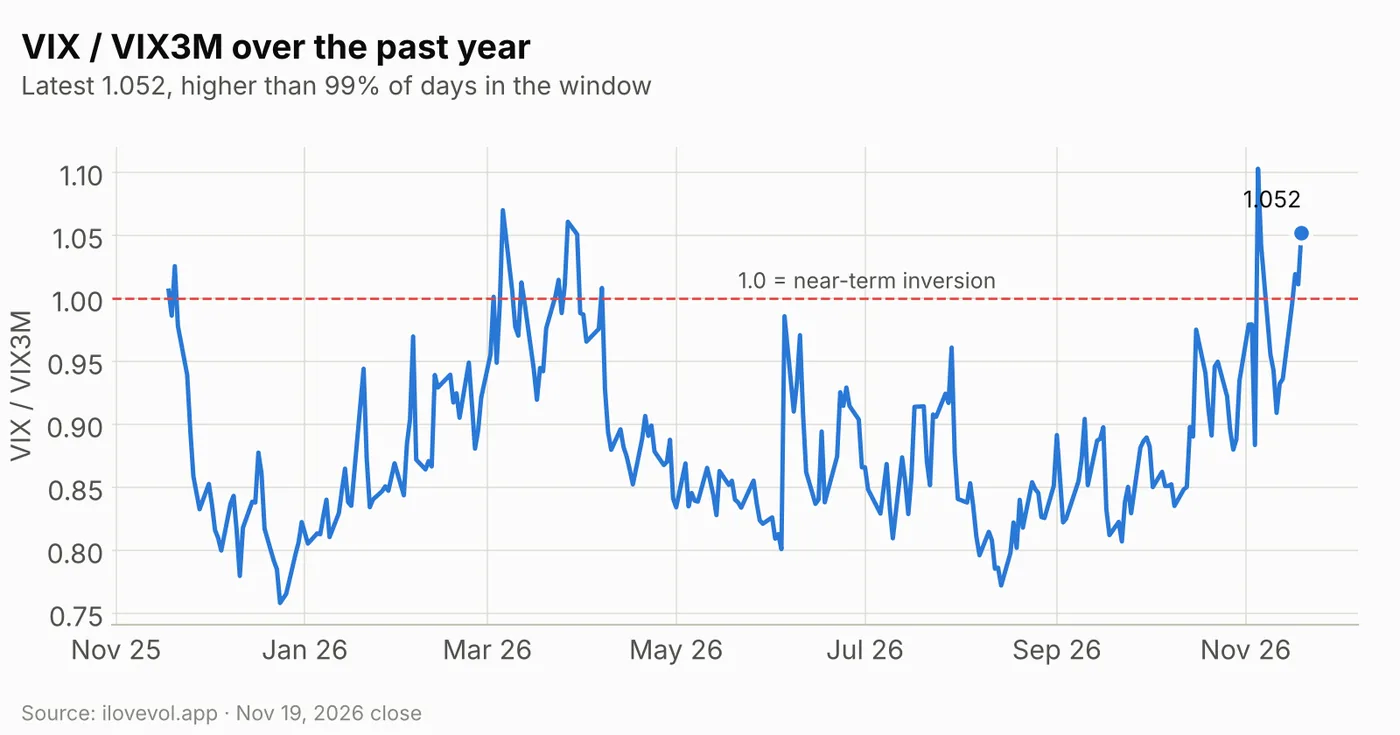
VIX/VIX3M rose to 1.052 from 1.011, further above the 1.0 inversion line and higher than 99% of the past year's sessions. The only comparable readings in the window came in March.
4. Implied vs realized: realized catches up, implied runs ahead
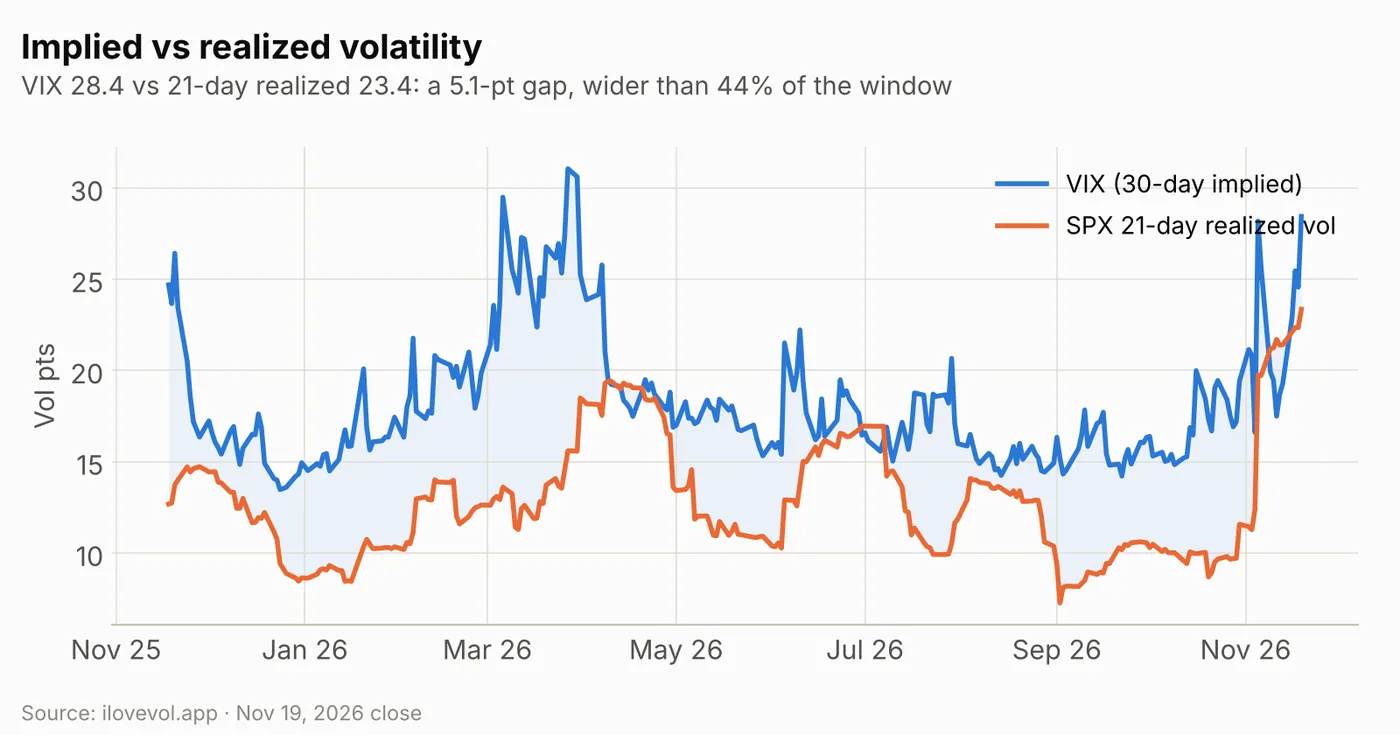
SPX 21-day realized vol rose to 23.4 from 22.4 after the 2% day. VIX at 28.4 now carries a +5.1-point premium over realized, up from +2.2 and wider than 44% of the past year. Thirty-day ATM IV on the stored surface (22.8%) is about 0.6 points under realized, so most of VIX's premium still comes from the put wing rather than at-the-money vol.
5. SPX surface: the front lifts most, skew steepens
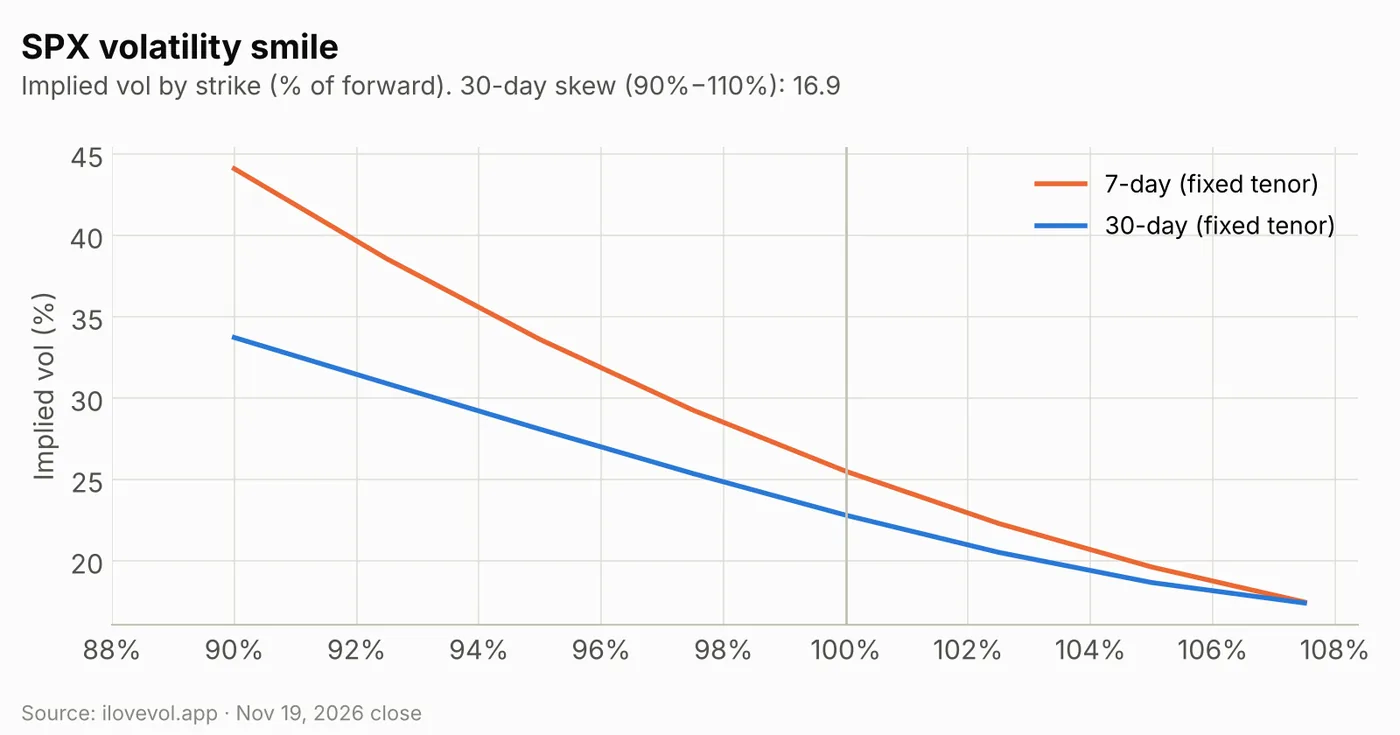
On the stored fixed-tenor surface, 30-day ATM IV rose to 22.8% from 19.8%, and 30-day skew (90% vs 110% of the forward) steepened to 16.9 points from 16.0. The 25-delta risk reversal widened to 8.7 from 7.3. The term structure got steeper at the front: 1-week ATM is 25.5% (from 22.0%), 1-month 22.8%, 3-month 20.5% and 1-year 19.8%, so the 1M–3M spread widened to 2.3 points from 1.6. The 7-day smile runs from about 44% at 90% of the forward to 25.5% at the money and about 17% at 108%.
The next-day expiry priced about 1.39% (roughly 100 points) for Friday at the close, up from 1.12% on Wednesday. Friday is the November monthly expiration, which on the live chain holds the largest single block of near-dated short gamma.
6. Cross-asset Vol Sentiment: US equities at the very bottom of the range
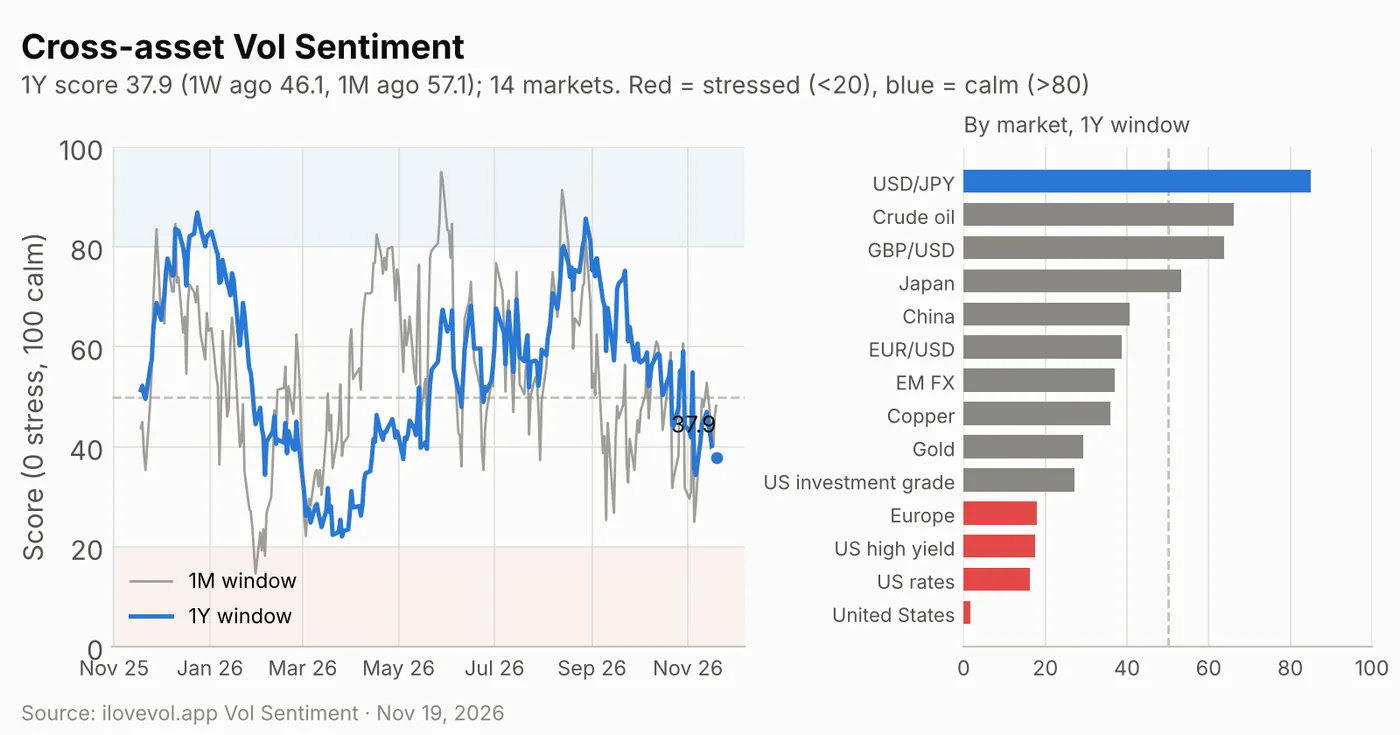
The cross-asset Vol Sentiment score places volatility in 14 equity, currency, rates, credit and commodity markets within its own one-year range (0 = stress, 100 = calm). On the one-year window it is 37.9, below the 50 midpoint but up slightly from 36.2 on Wednesday (revised); it was 46.1 a week ago and 57.1 a month ago. It is higher than only 15% of the past year's sessions. The one-month score is 48.2 (from 46.1) and the three-month score 29.2.
Four markets are in the stressed zone below 20: US equities (1.7), US rates (16.2), US high yield (17.5) and Europe (17.9). USD/JPY (85.0) is the only calm market, followed by crude oil (66.2) and GBP/USD (63.8). The US equities score uses the VIX and is now near the bottom of its one-year range, which repeats what the SPX surface shows. The added information is that the composite did not fall with it: outside US equities, rates and credit, most markets are mid-range, so the stress is concentrated in US assets. It is context, not a trading signal.
Calendar: the week ahead
Economic data & Fed
| Date | Time (ET) | Event | Note |
|---|---|---|---|
| Fri Nov 20 | 8:25 / 12:15 | Fed: Waller, Cook (expected) | Waller has floated a 50 bp December hike |
| Fri Nov 20 | 10:00 | University of Michigan sentiment (Nov, final) | Monthly expiry day; next-day move priced ~1.39% |
| Mon Nov 23 | 13:00 | 2-year note auction | 10-year yield near 5.05% |
| Tue Nov 24 | 10:00 | Consumer confidence (Nov) | 5-year note auction at 13:00 |
| Wed Nov 25 | 8:30 | Q3 GDP (second estimate), October PCE inflation, durable goods, jobless claims | Last data before the holiday |
| Wed Nov 25 | 10:00 / 14:00 | New home sales (Oct); Beige Book (expected) | 7-year note auction at 11:30 |
Earnings
| Date | Timing | Companies | Note |
|---|---|---|---|
| Thu Nov 19 | After close | Intuit, Ross Stores, Gap (expected) | Reaction in Friday's monthly expiry |
| Mon Nov 23 | After close | Hewlett Packard Enterprise, Agilent, Jacobs, Zoom (expected) | |
| Tue Nov 24 | Before open | Analog Devices, Medtronic, Best Buy, Dollar Tree, J.M. Smucker | Chip read-through after AMD and Nvidia |
| Tue Nov 24 | After close | Dell, HP Inc., Workday, Autodesk | AI hardware demand |
| Wed Nov 25 | Before open | Deere |
Volatility dates (expirations, events)
| Date | Event | Note |
|---|---|---|
| Fri Nov 20 | SPX November monthly expiration | AM settlement at the open, PM expiry at the close; live chain: about −$21.7B (AM) and −$14.9B (PM) |
| Thu Nov 26 / Fri Nov 27 | Thanksgiving / early close | Closed Thu; 1:00 pm close Fri. 1-week ATM 25.5% |
| Wed Dec 9 | FOMC decision | About 90% odds of a 25 bp hike priced |
| Wed Dec 16 | VIX December expiration | Dec future 24.54, 3.90 under spot |
| Fri Dec 18 | SPX December quarterly expiration | Within the 30-day window |
What I'm watching
- 7,100–7,000. The close sits just above the 7,100 strike (−$4.4B), with 7,000 (−$4.8B) the put wall for both the all-expiry and 30-day books. The profile stays near −$95B down to about 6,700, so there is no gamma cushion below.
- 7,300, then 7,460–7,520. The largest negative strike (−$6.6B), then the zone where the profile goes from about −$14B to zero (flips at 7,480, 7,501 and 7,518). A rebound sheds short gamma quickly once SPX is back above 7,300.
- Friday's monthly expiry. The AM-settled contracts settle at the open and the PM expiry at the close; together they carried about −$36.6B on the live chain. The next-day move is priced at about 1.39%, or 100 points.
- Backwardation. December VIX (24.54) is now above January (23.99) but still 3.90 under spot (28.44), and VIX/VIX3M is 1.052. Futures rising toward spot would mean the market no longer expects this level to fade.
- VIX1D above VIX. At 32.06 vs 28.44, the one-day gauge prices more stress for Friday than the 30-day average. A quiet expiry would let it drop fast, as it did after Nvidia on Wednesday.
Sources
- Yahoo Finance: Stock market today: Dow sinks 1,100 points, S&P 500 and Nasdaq tank 2% as Anthropic IPO grabs spotlight
- The Motley Fool: Dow Plunges 1,100 Points as the S&P 500 Suffers Its 6th Straight Day of Losses
- The Motley Fool: Nvidia Slides as Investors Weigh CEO Transition Fallout Despite Strong Q3 Results
- 24/7 Wall St.: S&P 500 Drops Nearly 2% at the Close as Rate Hike Talk Hits Markets
- 1Trader: US Jobless Claims 203K vs 196K Forecast; Philly Fed 6.3
- Admirals: Philly Fed Index Falls to 6.3 in November 2026
- TipRanks: Markets Brace for U.S. Jobless Claims and Factory Data After Fed Minutes Lock In Rate Hike Bets
- Helious: US Economic Calendar November 2026
- Portfolio Terminal: Earnings Calendar November 2026
- TheStreet: Earnings Calendar, Week of Nov 23
Volatility data: ilovevol.app. This issue uses the site's stored end-of-day history (VIX history, GEX history, vol-surface history and Vol Sentiment) because the live feeds were unavailable after the close; GEX and surface changes compare the stored Nov 19 and Nov 18 rows, so prior values can differ slightly from the Nov 18 issue. The stored GEX history drops AM-settled SPX monthly contracts after their last trading day; live-chain figures for those contracts are quoted where noted. GEX assumes dealers are long calls and short puts. VIX futures use settlement prices. Surface figures are fixed tenors (1 week, 1 month, ...). Vol Sentiment: ilovevol.app cross-asset score (0 = stress, 100 = calm), one-year window unless noted; day-over-day changes use the latest (revised) prior row.
This review is for informational and educational purposes only and is not investment advice. See the disclaimer.
The Daily Vol sends this review to your inbox each trading day: dealer gamma levels, the VIX curves, the SPX vol surface and the levels to watch. Free, one click to unsubscribe.