Home › Blog › Daily Market Review
Daily Market Review · US close
Nvidia fades and SPX slips a fifth day, but the event premium drains: VIX1D falls to 23.3
SPX fell 0.23% to 7,324, 225 points under its 7,549 flip, and net GEX eased to −$96.1B. VIX dropped 0.90 to 24.56 and VIX1D 3.59 to 23.25 after a 17-point day against a priced move of about 132. Levels for Thursday inside.
- Nvidia gave up its post-earnings gain (−2.9%), health insurers slid and FOMC minutes leaned toward more hikes: SPX −0.23% to 7,324, a fifth straight loss, Dow −561 points; NDX +0.42% ahead of Anthropic's debut.
- Net GEX eased to −$96.1B from −$98.5B. SPX is 225 points under a 7,549 flip, call walls dropped to 7,400, and Thursday–Friday expiries hold about 37% of the short gamma at spot.
- The Nvidia premium went unearned (about 132 points priced, 17 realized). VIX fell 0.90 to 24.56 and VIX1D 3.59 to 23.25; December VIX (21.94) is the new front month, 2.62 under spot.
Scoreboard
| Close | Chg | Prev | |
|---|---|---|---|
| SPX | 7,324 | −0.23% | 7,341 |
| NDX | 27,116 | +0.42% | 27,002 |
| VIX | 24.56 | −0.90 | 25.46 |
| VIX1D | 23.25 | −3.59 | 26.84 |
| VVIX | 118.4 | −2.9 | 121.3 |
| VX Dec / Jan | 21.94 / 22.00 | +0.27% M1→M2 | −8.30% (Nov/Dec) |
| VIX / VIX3M | 1.011 | −0.008 | 1.019 |
| 30D ATM IV / skew | 19.7% / 14.8 | −0.5 / −1.2 | 20.2% / 16.0 |
| Window | Net GEX | Chg | Prev | Flip | Call wall | Put wall | |
|---|---|---|---|---|---|---|---|
| SPX | All | −$96.1B | +$2.4B | −$98.5B | 7,549 | 8,000 | 7,000 |
| SPX | Weekly | −$45.7B | +$4.2B | −$49.9B | 7,553 | 7,400 | 7,300 |
| SPX | Monthly | −$79.9B | −$10.9B | −$69.0B | 7,565 | 7,400 | 7,000 |
| NDX | All | −$2.88B | +$0.14B | −$3.02B | 27,961 | 27,500 | 27,000 |
| NDX | Weekly | −$0.71B | +$0.15B | −$0.86B | 27,394 | 27,500 | 27,000 |
| NDX | Monthly | −$2.45B | −$1.03B | −$1.42B | 27,952 | 27,500 | 27,000 |
Dealer gamma by expiry window. All = every listed expiry; Weekly = contracts expiring within 7 calendar days; Monthly = within 30 days. Net GEX in $ per 1% move.
1. The tape: Nvidia beats and fades, the Dow sinks on health insurers
The S&P 500 slipped 16.90 points (0.23%) to 7,324, its fifth straight decline and its longest losing run since June, per CNBC as cited by StockTitan. The Dow lost 561 points (1.11%) to 50,198, while the Nasdaq Composite rose 0.42% to 24,430, the Nasdaq-100 0.42% to 27,116 and the Russell 2000 0.46% to 2,714.
Nvidia's beat did not hold. The stock rose before the open on $115.8B of revenue, up 103% from a year earlier, and roughly $130B of fourth-quarter guidance, then turned lower and closed down 2.89%, its fifth daily loss in a row, per StockTitan and Yahoo Finance. The company also said its 10-Q would come later than usual. Money moved instead into names tied to Anthropic, which Yahoo, citing Bloomberg, reported priced its IPO at $83 a share, above the $70–78 range, ahead of a planned Nasdaq debut on Thursday. Broadcom and Amazon were higher, and cybersecurity rallied: Palo Alto Networks closed up 9.3% and CrowdStrike 8.3% per 24/7 Wall St., and Palo Alto then reported fiscal first-quarter revenue up 39% after the bell.
The Dow's drop came mostly from managed care. UnitedHealth fell about 10%, Humana 13% and Elevance about 7.6% after a proposed Medicare Advantage rule. Retail was firmer: Target rose 4.0% and TJX about 8% after beating estimates. Energy was the weakest sector as WTI fell about 3% to near $82 on rising inventories, and gold dropped about 3.5%.
FOMC minutes from the Oct 27–28 meeting showed almost all officials judging that further hikes would likely be appropriate, and two governors preferred a quarter-point hike in October. Governor Waller said on CNBC that a half-point hike may be needed in December. Per Yahoo, CME FedWatch puts 69% odds on 50 basis points of hikes by the end of January. The 10-year yield eased to about 5.07%.
Why it matters for vol: Tuesday's surface paid for an Nvidia shock that never came to the index. The first expiry after the report priced about 132 points and SPX moved 17, so the front end deflated even on a down day. What remains is a market sitting well below its gamma flip, with hawkish Fed pricing and fresh supply from a very large IPO on Thursday.
2. Dealer gamma: still deeply short, slightly less so
Net GEX across all expiries eased to −$96.1B per 1% move from −$98.5B. The flip dropped to 7,549 from 7,589, so SPX now closes 225 points (3.1%) below it, against 248 points on Tuesday. The small change is mostly the flip coming down toward price; the index itself barely moved.
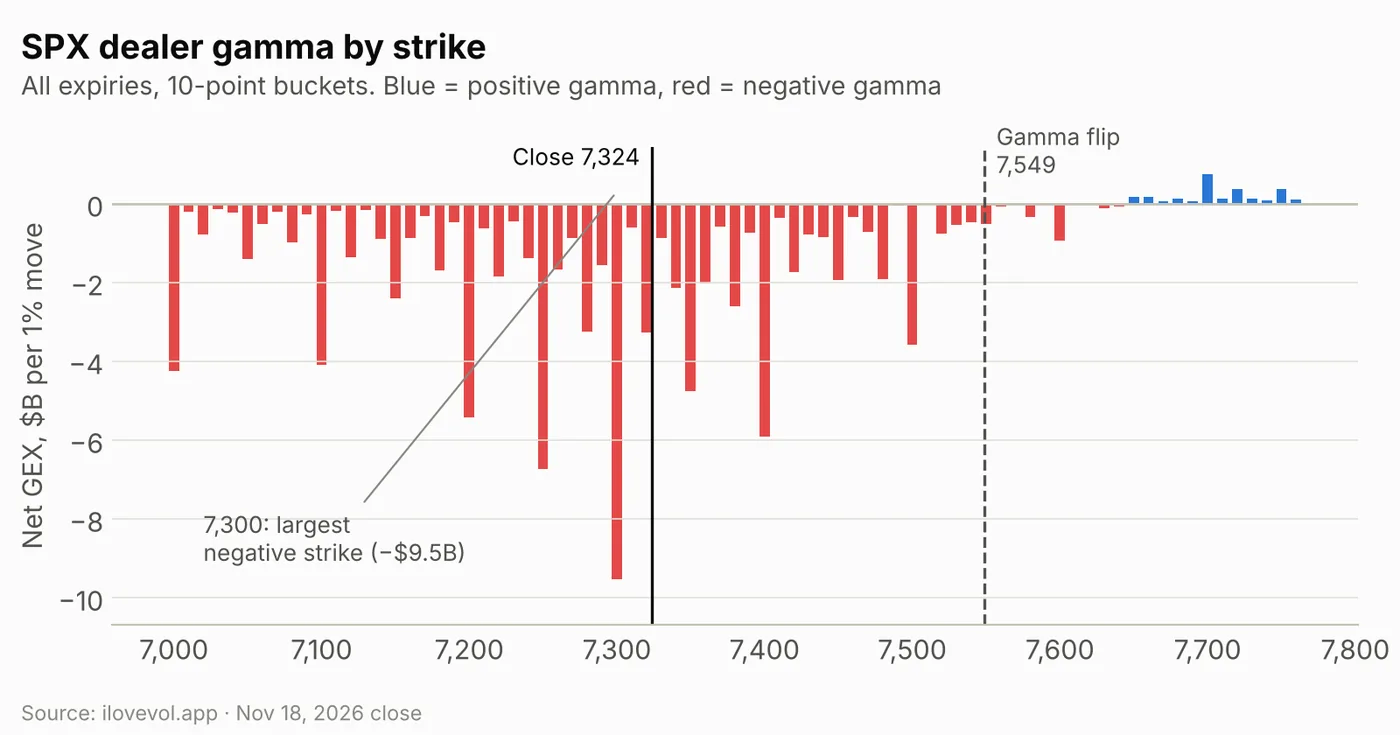
Every bucket from 7,000 to 7,610 is still negative, and the first positive bucket above spot is 7,620. The largest negative strikes are 7,300 (−$9.5B), 7,250 (−$6.7B), 7,400 (−$5.9B), 7,200 (−$5.4B) and 7,350 (−$4.8B). The close sits just 24 points above the biggest one. The positive side remains thin, led by 7,700 at +$0.75B.
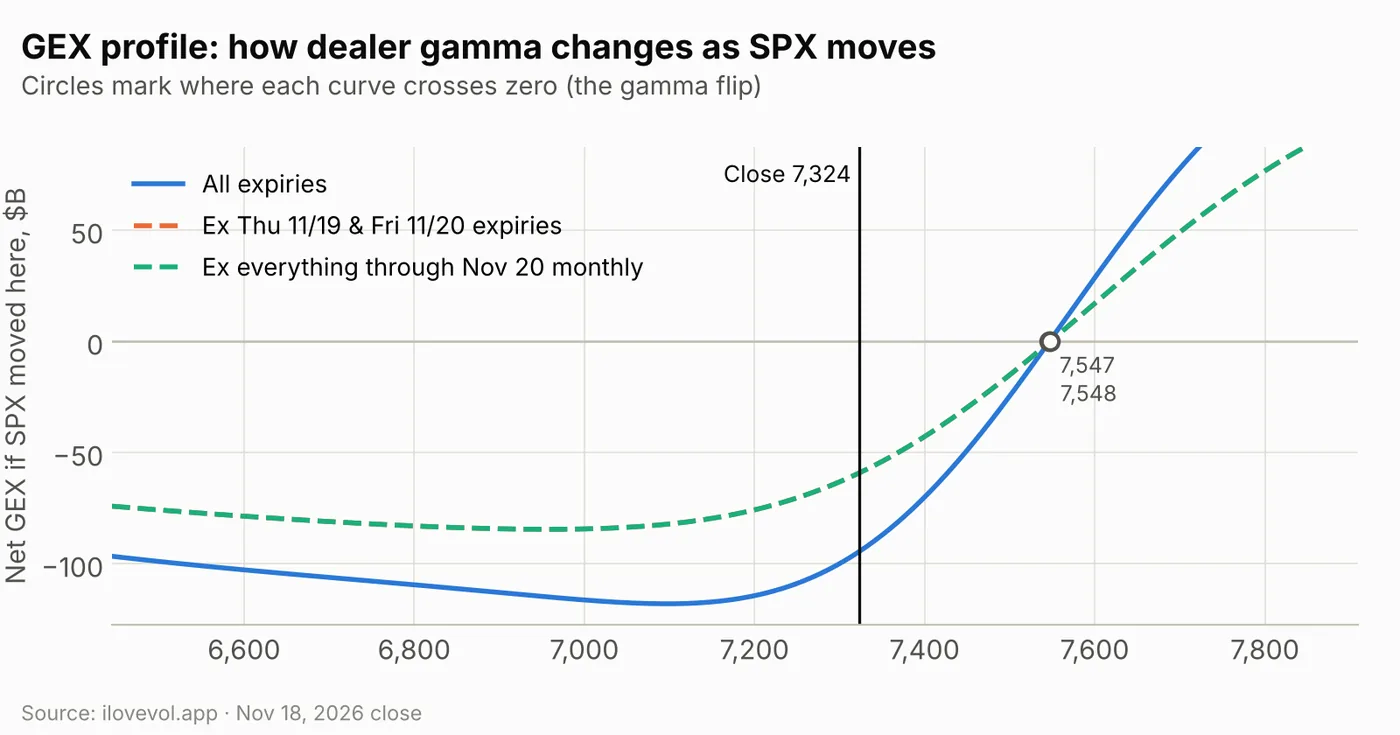
The modeled profile reads about −$94B at the close and crosses zero near 7,547. Above spot it rises quickly: about −$70B at 7,400, −$25B at 7,500 and roughly zero at 7,550. Below spot it flattens: −$100B at 7,300, −$114B at 7,200 and a floor near −$118B around 7,100. A rebound sheds short gamma much faster than a further decline adds it.
Thursday and Friday hold about 37% of it. The two dashed curves coincide, because removing the Nov 19–20 expiries is the same as removing everything through the Nov 20 monthly. Without them, modeled gamma at spot is about −$59B and the flip barely moves (near 7,548). Most of the rest sits in December, including the Dec 18 quarterly, so the book stays short at this price after Friday.
Weekly vs monthly: call walls step down to 7,400
The three SPX flips sit within 16 points of each other, 225–241 points above the close: all-expiry 7,549, weekly 7,553 and monthly 7,565 (numbers in the dealer-gamma table under the scoreboard). Both call walls moved down to 7,400 from 7,500. The weekly put wall stayed at 7,300, while the monthly put wall dropped to 7,000. The close sits inside a 100-point weekly band, 24 points above the put wall and 76 under the call wall.
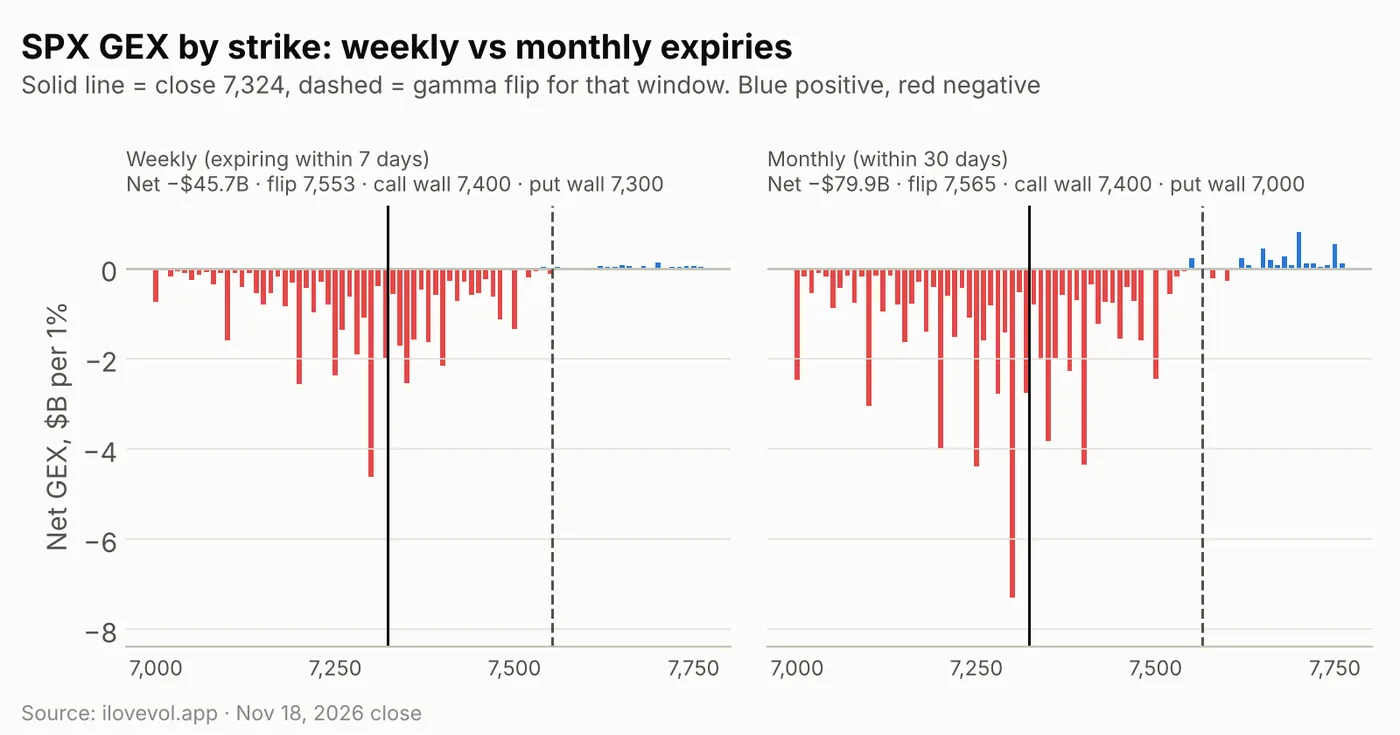
SPX weekly: the next 7 days hold −$45.7B across five expiries from Nov 19 to Nov 25, about 48% of the all-expiry total and $4.2B less negative than Tuesday as the Nov 18 expiry rolled off. The largest weekly buckets are 7,300 (−$4.6B), 7,200 (−$2.6B), 7,350 (−$2.5B), 7,250 (−$2.4B) and 7,400 (−$2.2B). Positive weekly gamma is negligible, at most +$0.13B at 7,700.
SPX monthly: the 30-day window deepened to −$79.9B from −$69.0B (flip 7,565, call wall 7,400, put wall 7,000). Most of that is the calendar: the window now reaches the large Dec 18 quarterly expiry. Its largest buckets are 7,300 (−$7.3B), 7,250 (−$4.4B), 7,400 (−$4.4B) and 7,200 (−$4.0B). That leaves about −$34.2B in expiries 8–30 days out and about −$16.2B beyond 30 days, so the longer-dated book still adds to the short gamma rather than offsetting it.
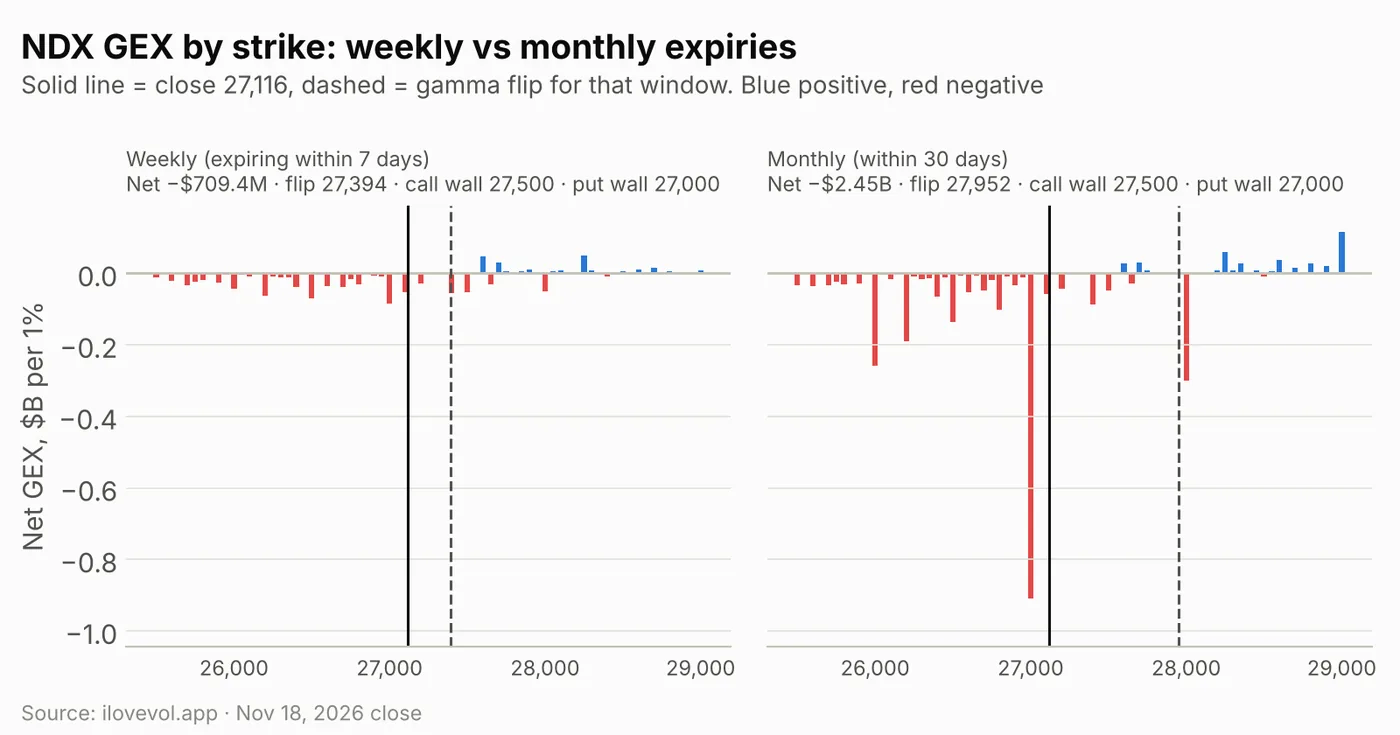
NDX rose 0.42% to 27,116 and its short gamma eased slightly to −$2.88B from −$3.02B. It is 845 points under its 27,961 all-expiry flip, 278 under the weekly flip (27,394) and 836 under the monthly flip (27,952). All three windows share a 27,500 call wall and a 27,000 put wall; the index closed 116 points above the put wall. The weekly window is −$0.71B. The monthly window deepened to −$2.45B as it picked up December, with by far its largest bucket at 27,000 (−$0.91B), then 28,000 (−$0.30B).
RUT rose 0.46% to 2,714, with short gamma little changed at −$3.62B (−$3.59B Tuesday). It sits 101 points under its 2,815 flip, with the call wall at 2,765 and the put wall at 2,700.
3. The VIX complex: the event premium drains, the curve un-kinks
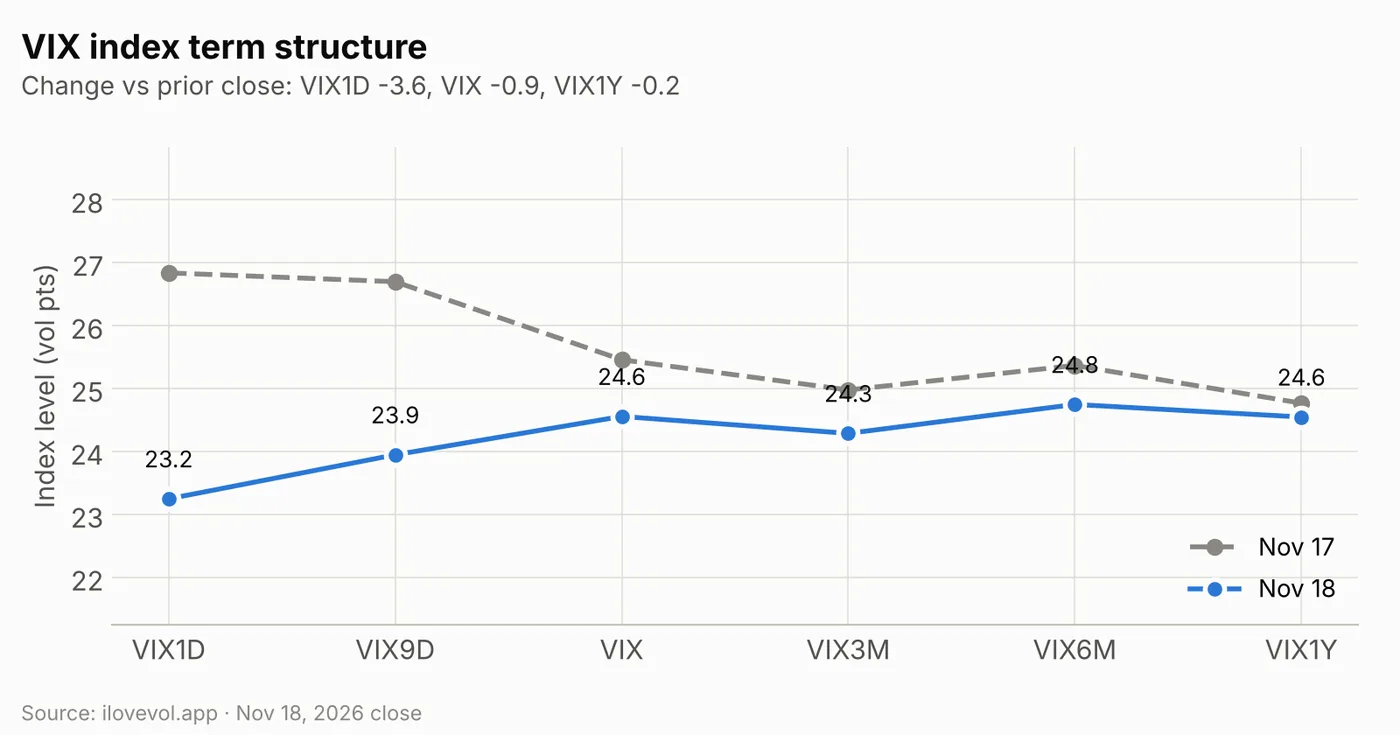
The front end gave back the Nvidia premium. VIX1D fell 3.59 to 23.25 and VIX9D 2.75 to 23.95, while VIX lost 0.90 to 24.56, VIX3M 0.69 to 24.29, VIX6M 0.62 to 24.75 and VIX1Y 0.22 to 24.55. The index curve is no longer inverted from one day to three months; it now rises from VIX1D to VIX, with only a small dip at VIX3M.
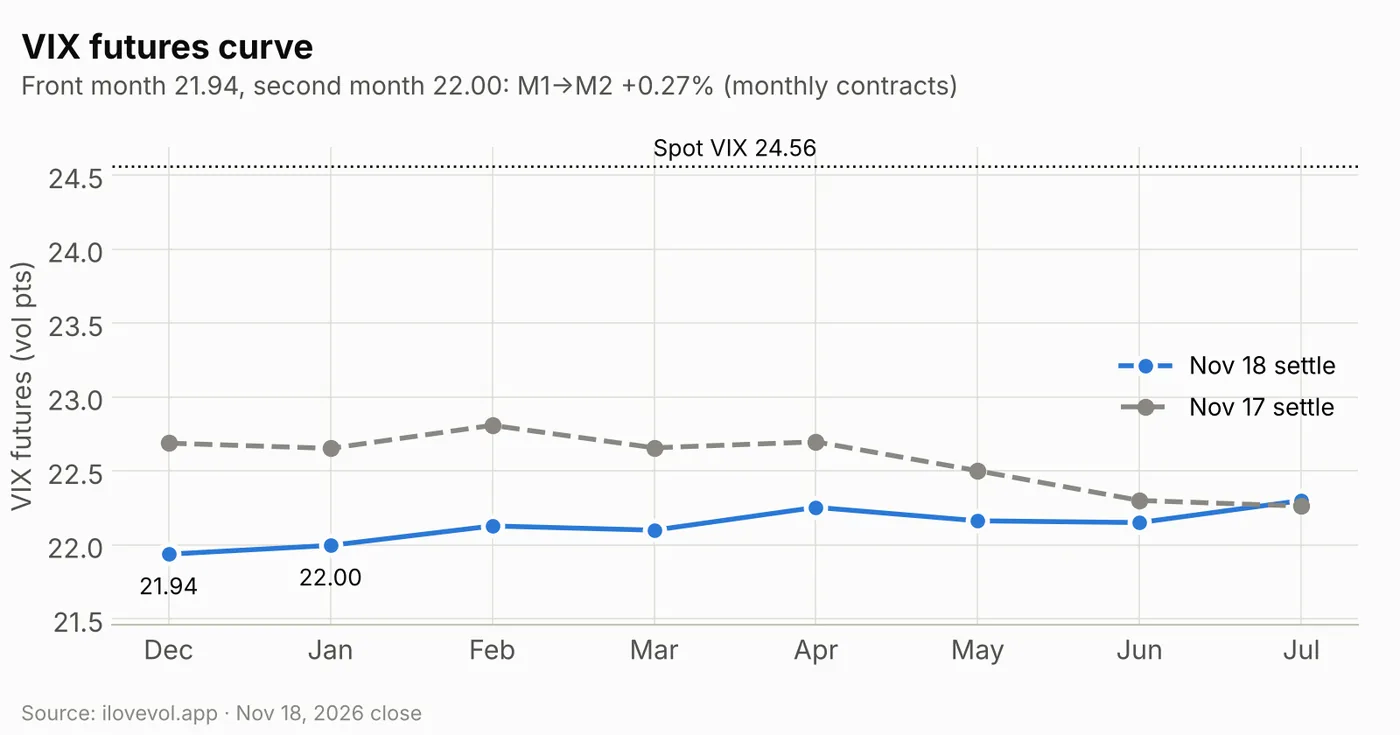
November VIX futures and options expired on Wednesday morning's settlement, so December is now the front month. It settled at 21.94, down 0.75, and January at 22.00, down 0.65, which puts M1→M2 at +0.27%, slight contango, against −8.30% for the November/December pair on Tuesday. Most months fell 0.6–0.7 points; July was flat at 22.30. The whole futures curve still sits 2.3–2.6 points under spot VIX, so the market expects today's level to fade. VVIX eased 2.9 to 118.4.
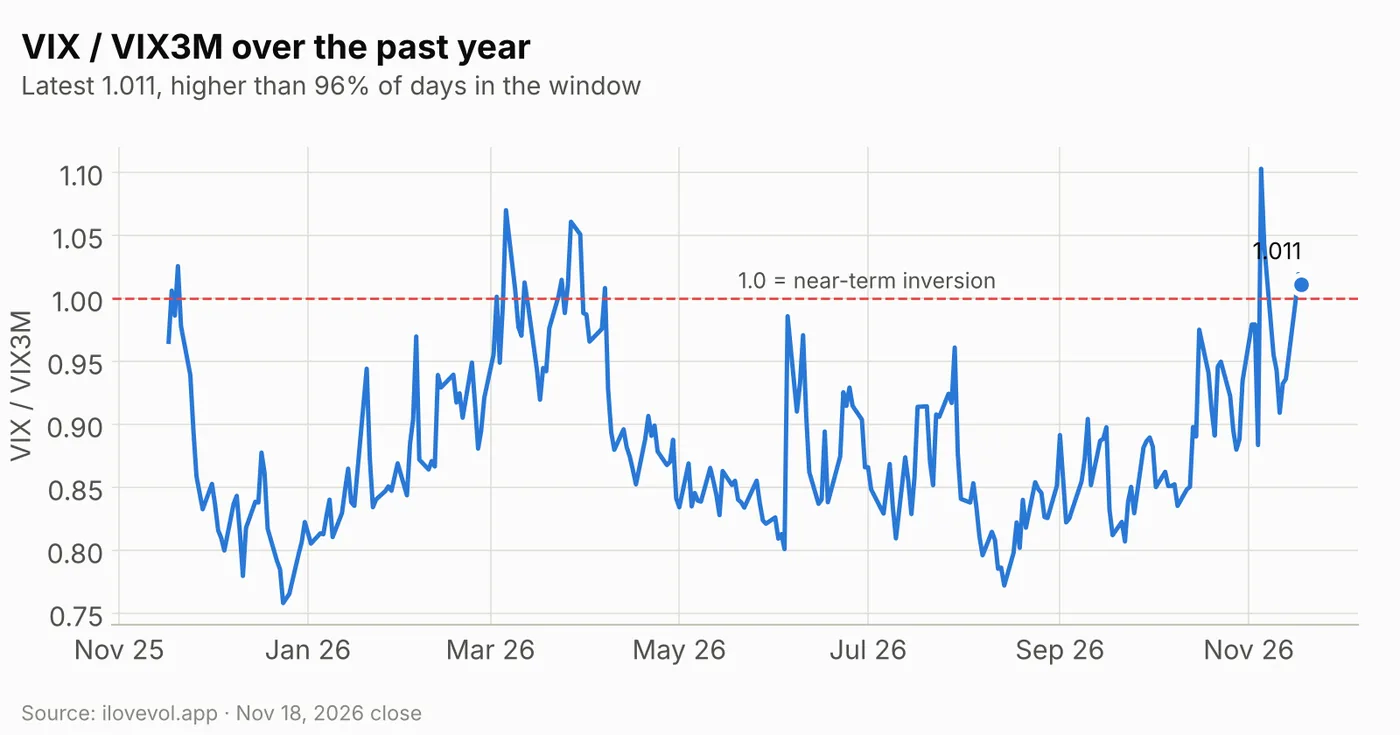
VIX/VIX3M slipped to 1.011 from 1.019. It is still above the 1.0 inversion line and higher than 96% of the past year's sessions.
4. Implied vs realized: a thin cushion
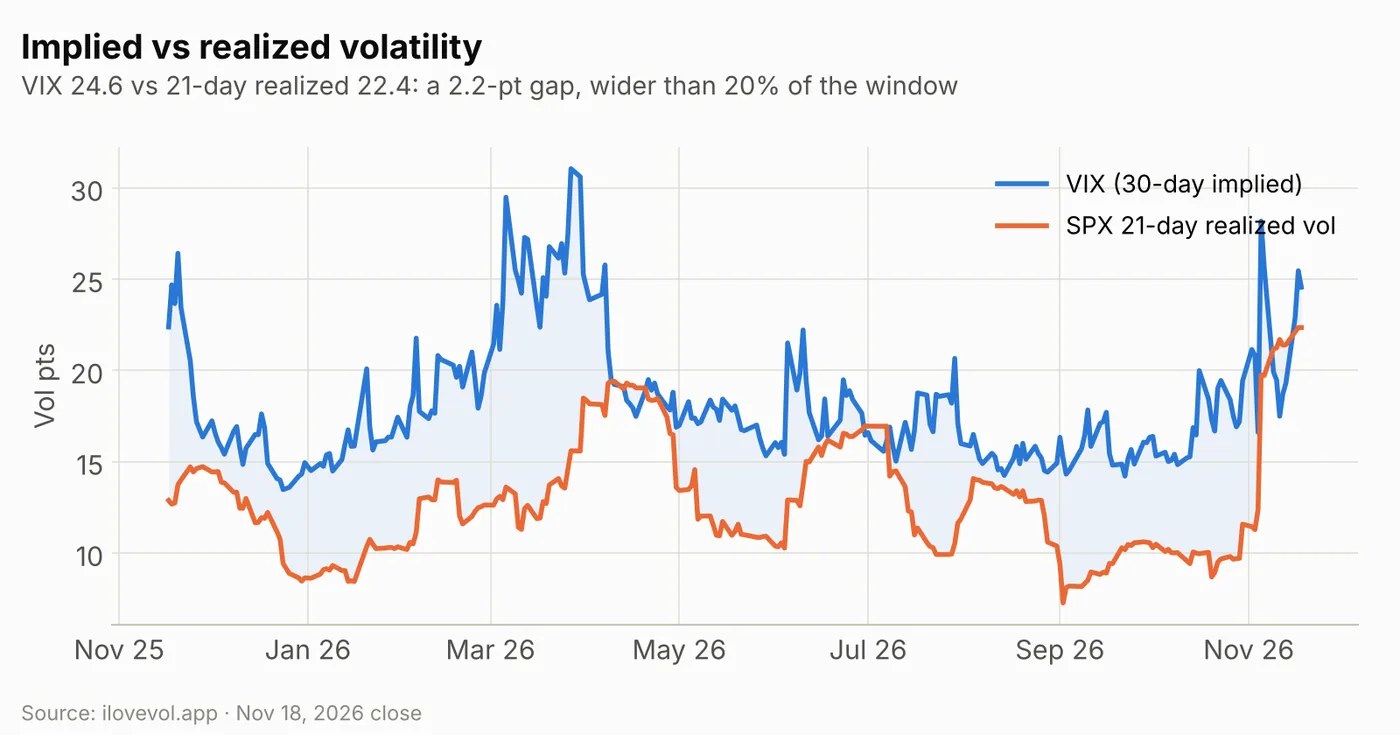
SPX 21-day realized vol held at 22.4. With VIX at 24.6, the gap narrowed to +2.2 points from +3.1, wider than only 20% of the past year. Thirty-day ATM IV (19.7%) is about 2.7 points under realized, so VIX's premium over realized still comes from the put wing rather than at-the-money vol.
5. SPX surface: front-end premium comes out, skew flattens
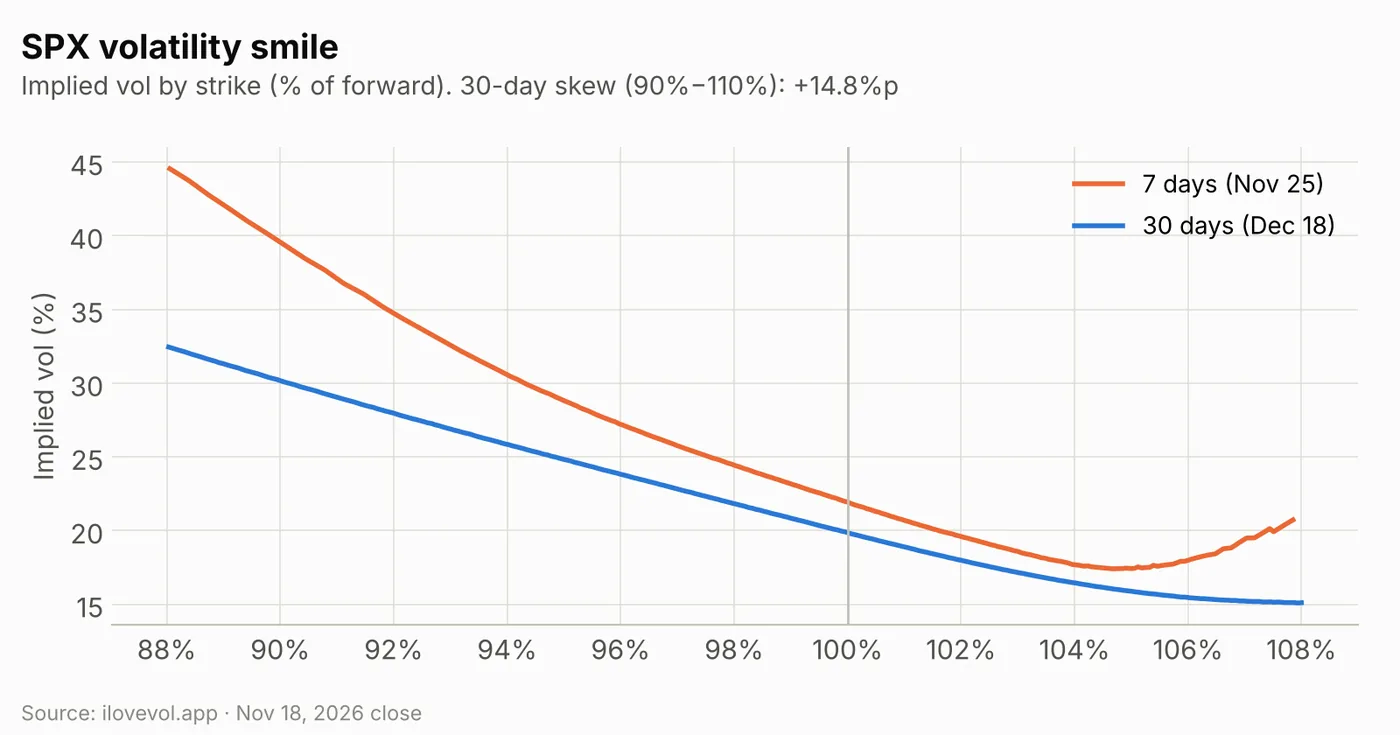
Thirty-day ATM IV eased to 19.7% from 20.2%, and 30-day skew (90% vs 110%) flattened to 14.8 points from 16.0. The 90-day minus 30-day slope is −1.5 points, from −1.7. The 7-day smile (Nov 25) runs from about 45% at 88% of the forward to about 22% at the money, bottoms near 17% around 105% and curls up to about 21% at 108%. The 30-day curve (Dec 18) runs from about 33% to about 15%.
Across the expiry table, Thursday's Nov 19 expiry fell to 27.0% ATM from 29.1%, about 125 points for one session, and the Nov 20 monthly to 25.8% from 26.8%, about 168 points through Friday. Next week is cheaper: 21.0–22.1% for Nov 23–25, with a small bump for Nov 25 (GDP and PCE) over Nov 24 (21.7%), 20.8% for the Nov 27 half-day and 19.7% for Nov 30. Further out, the Dec 9 expiry, the day of the next FOMC decision, is 20.0% against 19.7% for Dec 8.
6. Cross-asset Vol Sentiment: US equities and rates stay at the stressed end
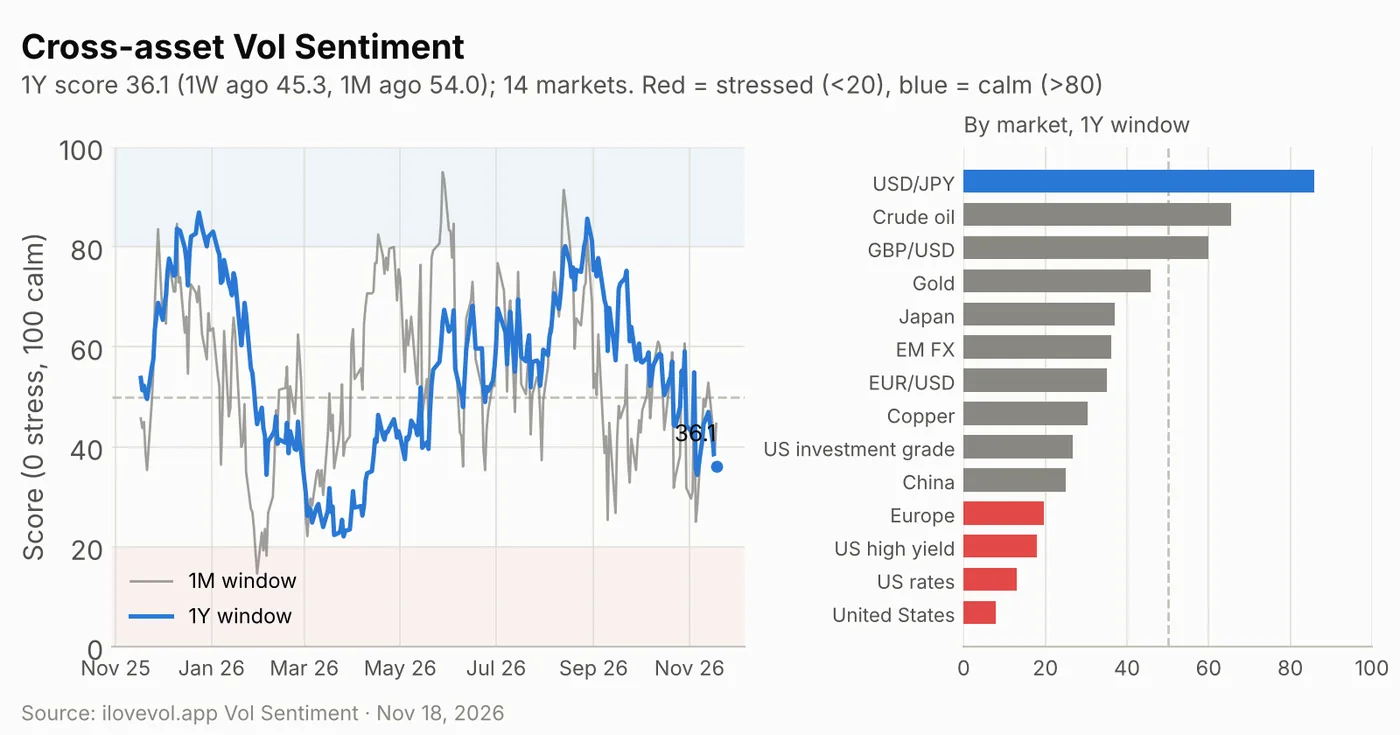
The cross-asset Vol Sentiment score places volatility in 14 equity, currency, rates, credit and commodity markets within its own one-year range (0 = stress, 100 = calm). On the one-year window it is 36.1, below the 50 midpoint and down from 36.6 on Tuesday (revised), 45.3 a week ago and 54.0 a month ago. It is higher than only 13% of the past year's sessions. The short window reacted to Wednesday's calmer equity session: the one-month score rose to 44.6 from 38.2, while the three-month score is 26.4.
Four markets are in the stressed zone below 20: US equities (7.9), US rates (12.9), US high yield (17.9) and Europe (19.6). USD/JPY (85.8) is the only calm market, followed by crude oil (65.4) and GBP/USD (60.0). The US equities score uses the VIX, so it repeats what the SPX surface shows; the added information is that rates and high-yield credit vol sit at the same stressed end after hawkish Fed minutes. It is context, not a trading signal.
Calendar: the week ahead
Economic data & Fed
| Date | Time (ET) | Event | Note |
|---|---|---|---|
| Thu Nov 19 | 8:30 | Jobless claims, Philadelphia Fed survey (Nov) | Nov 19 expiry 27.0% ATM, about 125 pts |
| Thu Nov 19 | 12:30 / 16:00 | Fed: Goolsbee, Barkin (expected) | After hawkish minutes |
| Fri Nov 20 | 8:25 / 12:15 | Fed: Waller, Cook | Waller floated a 50 bp December hike |
| Fri Nov 20 | 10:00 | University of Michigan sentiment (Nov) | Monthly expiry day |
| Tue Nov 24 | 10:00 | Consumer confidence (Nov) | |
| Wed Nov 25 | 8:30 | Q3 GDP (second estimate), October PCE inflation, jobless claims | Nov 25 expiry 22.1% ATM vs 21.7% Nov 24 |
| Wed Nov 25 | 10:00 / 14:00 | New home sales (Oct); Beige Book |
Earnings
| Date | Timing | Companies | Note |
|---|---|---|---|
| Thu Nov 19 | Before open | Walmart, Williams-Sonoma | |
| Thu Nov 19 | After close | Intuit, Ross Stores, Keysight, Gap | Reaction in the Nov 20 monthly |
| Mon Nov 23 | After close | Zoom, Agilent (expected) | |
| Tue Nov 24 | Before open | Medtronic, Analog Devices, Best Buy, Dick's, Dollar Tree | |
| Tue Nov 24 | After close | Dell, HP, Workday, Autodesk | AI hardware read-through after Nvidia |
| Wed Nov 25 | Before open | Deere |
Volatility dates (expirations, events)
| Date | Event | Note |
|---|---|---|
| Thu Nov 19 | Anthropic (ANT) Nasdaq debut (expected) | Reported priced at $83, above range |
| Fri Nov 20 | SPX November monthly expiration | 25.8% ATM, about 168 pts through Friday; ~37% of short gamma at spot rolls off Thu–Fri |
| Thu Nov 26 / Fri Nov 27 | Thanksgiving (closed) / 1:00 pm early close | Nov 27 expiry 20.8% ATM |
| Wed Dec 9 | FOMC decision | Dec 9 expiry 20.0% vs 19.7% Dec 8 |
| Wed Dec 16 | VIX December expiration | Dec future 21.94, 2.62 under spot |
| Fri Dec 18 | SPX December quarterly expiration | 19.7% ATM; now inside the 30-day window |
What I'm watching
- 7,300. The weekly put wall and the largest negative strike (−$9.5B), 24 points under the close. The profile is about −$100B there and bottoms near −$118B around 7,100, so it flattens below spot rather than steepening.
- 7,400, then 7,500–7,565. The new weekly and monthly call wall, then the zone where the profile goes from about −$25B to zero (flips at 7,549, 7,553 and 7,565). A rebound would shed short gamma quickly.
- Friday's roll-off. Removing the Nov 19–20 expiries cuts modeled gamma at spot from about −$94B to −$59B. The Nov 20 monthly prices 25.8% ATM, about 168 points through Friday.
- Futures below spot. December VIX (21.94) sits 2.62 under spot (24.56) and VIX/VIX3M is 1.011. If spot drifts toward the futures, the inversion was event premium; if futures rise to meet spot, it is not.
- Next week's event bump. Nov 25 (GDP and PCE) prices 22.1% ATM vs 21.7% for Nov 24, against 30-day realized of 22.4.
Sources
- StockTitan: Stock Market Today, November 18, 2026: The Dow Closes Lower
- Yahoo Finance: Stock market today: Dow and S&P 500 slide, Nasdaq rises in anticipation of Anthropic IPO
- 24/7 Wall St.: S&P 500 Closes Nearly Flat While the Dow Drops 1% and Nasdaq Gains
- FedRateCalc: November 2026 U.S. Economic Calendar
- financecalendar.com: Events for November 2026
- ifyouspent: Thanksgiving-week earnings: Dell, Workday, Zoom, HP, Deere
- Newsquawk: Weekly US Earnings Estimates, 16–20 November 2026
- Next Earnings Date: November 2026 Earnings Calendar
Volatility data: ilovevol.app. GEX assumes dealers are long calls and short puts. VIX futures use settlement prices; the November contract expired on Nov 18, so M1/M2 are now December/January. Implied moves are approximations from expiry ATM IV over the trading sessions to expiry. Vol Sentiment: ilovevol.app cross-asset score (0 = stress, 100 = calm), one-year window unless noted; day-over-day changes use the latest (revised) prior row.
This review is for informational and educational purposes only and is not investment advice. See the disclaimer.
The Daily Vol sends this review to your inbox each trading day: dealer gamma levels, the VIX curves, the SPX vol surface and the levels to watch. Free, one click to unsubscribe.