Home › Blog › Quant Research
Delta Hedging P&L and Gamma Scalping: Where Option Traders Make and Lose Money
Buy an option, hedge its delta, and what is left is a pure bet on volatility: you win if the market moves more than the option price implied and lose if it moves less. That is true on average and misleading in practice. This article follows the P&L of a delta-hedged option day by day, shows why the result depends on the path the index takes and not only on realized volatility, and tests it with an S&P 500 straddle hedged every day for 24 years.
1. What is left after hedging delta
An at-the-money option starts out moving about half as much as the index, but its delta keeps changing. A long call gains delta as the market rises and loses it as the market falls. That curvature is gamma, and it is what makes an option worth more than a straight line: your exposure grows when the move goes your way and shrinks when it goes against you.
Delta hedging removes the straight-line part. A trader who owns a straddle sells index futures when the market rises (because the straddle's delta turns positive) and buys them back when it falls. Every hedge sells higher and buys lower than the one before. That is gamma scalping. The price of the privilege is the option's daily time decay, theta. Nothing else is left: no direction, just a race between what you earn from movement and the rent you pay for the option.
2. One day's P&L
Over one day, a delta-hedged option position earns approximately
daily P&L ≈ ½ · Γ · S² · [ (ΔS / S)² − σimp² · Δt ]
where Γ is the option's gamma, S the index level, ΔS/S the day's return, σimp the implied volatility the option was bought at and Δt one day (1/252 of a year). The first term is the gamma gain, always positive because the return is squared. The second is theta: in Black-Scholes the theta of a hedged position equals −½ · Γ · S² · σimp². It is the gamma–theta trade-off written as an accounting identity.
Inside the brackets, the day is profitable when the actual move is larger than σimp · √Δt. That break-even move is easy to work out in your head: divide implied volatility by about 16, the square root of 252.
| Implied volatility | Daily break-even move | Points at SPX 7,500 |
|---|---|---|
| 10% | 0.63% | 47 |
| 15% | 0.94% | 71 |
| 20% | 1.26% | 94 |
| 30% | 1.89% | 142 |
A long-gamma position bought at 15% volatility makes money on days when the S&P 500 moves more than about 71 points in either direction and pays theta on every day it moves less. Most days are quiet, so most days lose a little. The occasional big day pays for many quiet ones, because the gain grows with the square of the move: a 2% day earns four times the gamma P&L of a 1% day.
3. Over the life of the option, the path matters
Add up the days and you get the total P&L of the position hedged to expiry:
total P&L ≈ Σ ½ · Γt · St² · [ rt² − σimp² · Δt ]
If gamma were constant, this would be proportional to realized variance minus implied variance, and the trade would be a clean bet on realized against implied volatility. Gamma is not constant. It is largest when the index sits near the strike close to expiry, and it fades as the index moves away. A big move only counts in full if it happens while the option is still near the money. The same realized volatility can produce very different P&L depending on when and where the moves happen.
February 2020 is the clearest example. A 1-month at-the-money straddle bought on February 21 was priced at 14.2% implied volatility. Over the next 21 sessions the S&P 500 realized 88% volatility, one of the most violent months on record. The delta-hedged straddle still earned only about 8 vol points.
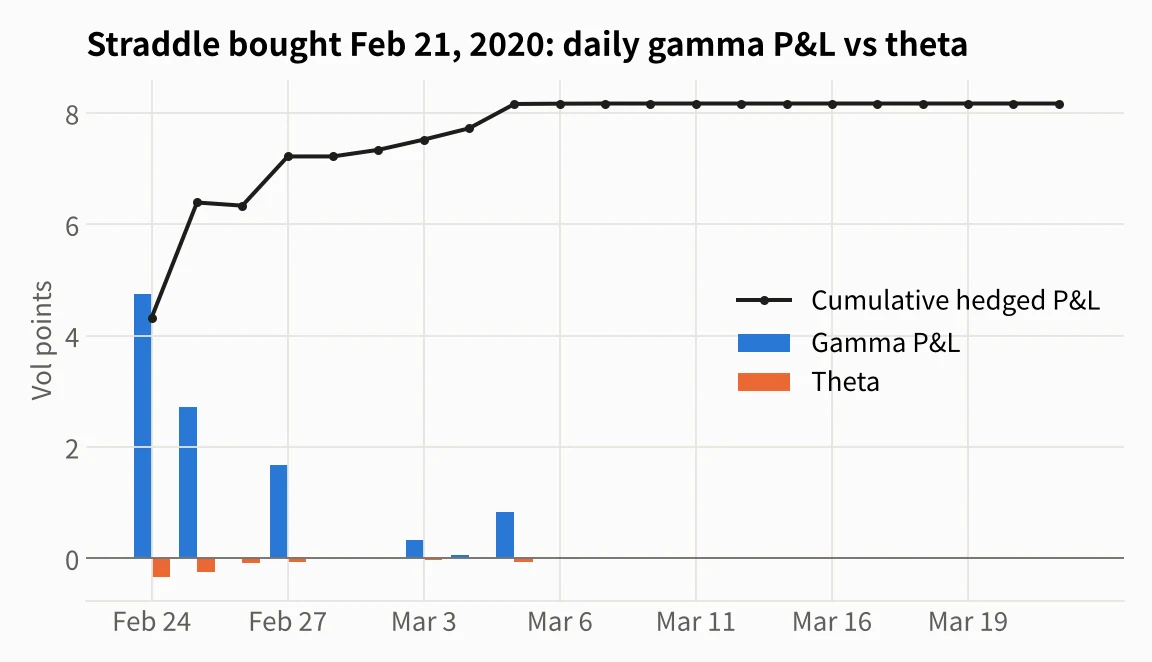
Almost all of the gain came in the first week, while the index was still near the 3,338 strike. By February 28 the index was 11% lower and the straddle was deep in the money, behaving like a short futures position the hedges had already offset. With gamma close to zero, the far larger moves of March, including several 5–12% days, added almost nothing. The position captured less than a tenth of the gap between realized and implied volatility although the volatility call was right.
4. An SPX straddle hedged daily for 24 years
To see how the formula works in real data, I ran the same trade on every session from February 2002 to October 2026.
- Trade: buy a 21-session at-the-money SPX straddle at the close, priced with Black-Scholes at that day's 1-month at-the-money implied volatility.
- Implied volatility: the constant-maturity 1-month ATM volatility from the site's SPX volatility surface history, fitted to each day's closing option chain.
- Hedge: rebalance delta with the index at every close, using the Black-Scholes delta at implied volatility. Hold to expiry and settle at the close.
- Units: P&L ÷ straddle vega at entry, which reads roughly as vol points: +2 means the trade earned as much as a 2-point rise in implied volatility would have. Rates, dividends and trading costs are set to zero.
That gives 6,182 overlapping trades. The first question is whether P&L follows realized minus implied volatility, as the formula says.
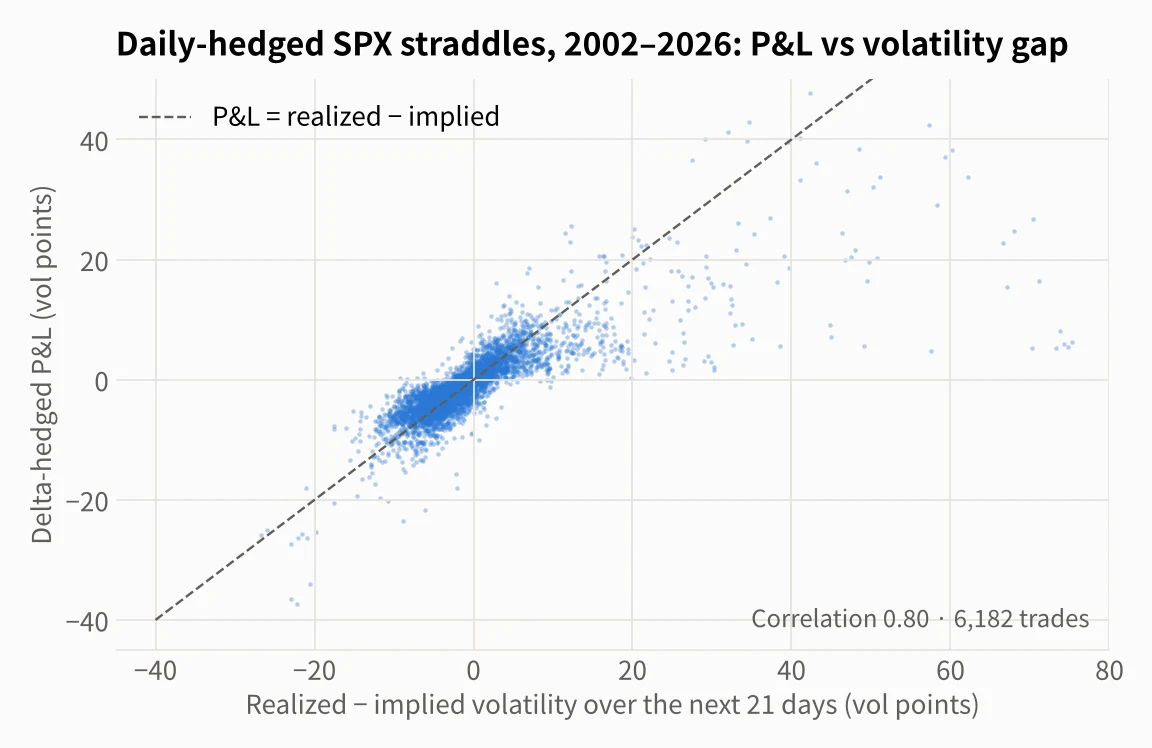
It does: the correlation is 0.80. In ordinary months the dots sit close to the line. The exception is on the right. When realized volatility explodes, P&L almost always falls below the line, because big moves push the index away from the strike and gamma disappears, exactly as in February 2020. What a delta-hedged option really earns is gamma-weighted realized volatility, and in a one-way crash that is far lower than the headline number.
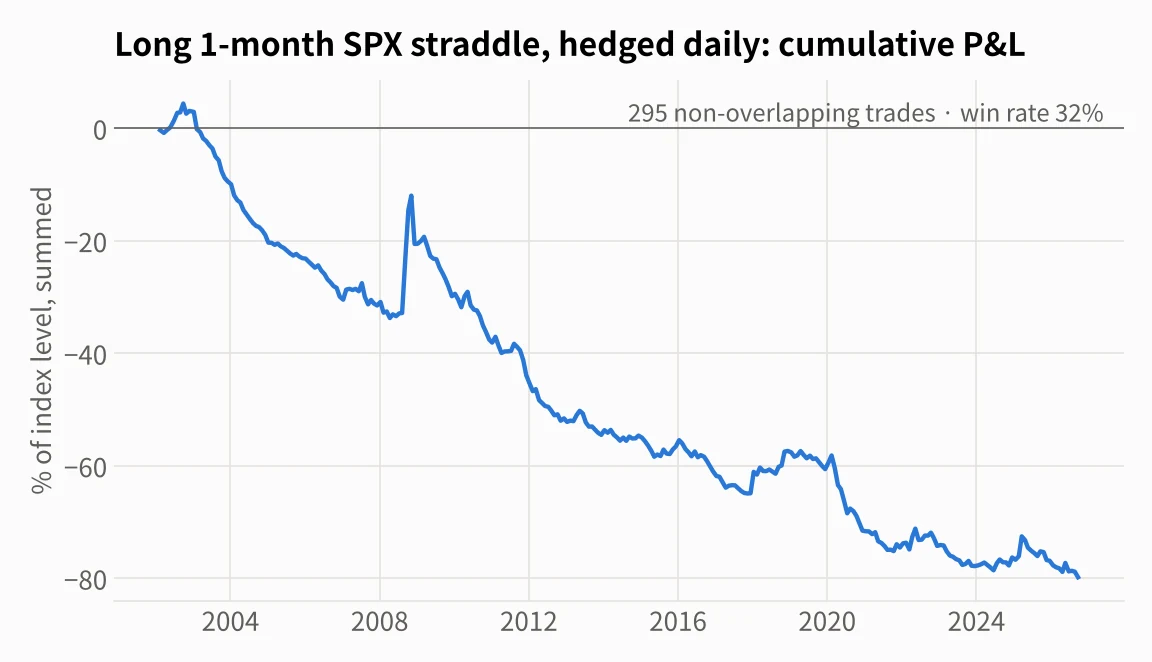
The second question is whether buying volatility this way paid on average. It did not.
| Entered every day, 2002–2026 | Value |
|---|---|
| Average P&L (vol points) | −1.1 |
| Median P&L (vol points) | −1.6 |
| Trades that made money | 31% |
| Trades where realized volatility was below implied | 71% |
| Average P&L of the best 5% of trades | +12.8 |
| Average P&L of the other 95% | −1.8 |
This is the variance risk premium seen from the buyer's side. Implied volatility was above the volatility that followed about seven times in ten, so the long-gamma position mostly lost a little and occasionally won big: September–October 2008, late February–March 2020 and, on a smaller scale, April 2025. Bakshi and Kapadia (2003) documented the same pattern in delta-hedged S&P 500 options in the 1980s and 1990s, and read the average loss as the premium investors pay to insure against volatility spikes.
Buying volatility in calm markets cost the least. With implied volatility at or below 12%, the average trade lost only 0.2 vol points; between 16% and 30% it lost 1.7–1.8. Above 30%, realized matched implied on average, but the trade still lost because of the path effect described above. The worst trades were straddles bought in December 2008 at 50–60% implied volatility, just before the market calmed down: realized volatility came in 20–25 points lower and they lost up to 37 vol points.
| Implied volatility at entry | Trades | Avg realized − implied | Avg P&L (vol points) |
|---|---|---|---|
| 12% or less | 1,768 | −0.1 | −0.2 |
| 12–16% | 1,907 | −1.2 | −1.1 |
| 16–20% | 1,062 | −1.7 | −1.7 |
| 20–30% | 1,082 | −1.8 | −1.8 |
| Above 30% | 363 | 0.0 | −1.4 |
5. How often to hedge
The formula assumes continuous hedging. Real traders hedge a few times a day at most, and every hedge costs money. Hedging less often does not change the expected P&L, but it adds noise, because between hedges you carry unhedged delta and the outcome depends on luck. Derman and Kamal (1999) showed that for an at-the-money option the standard deviation of this hedging error is about √(π/4) · σ / √N in vol points, where N is the number of hedges over the option's life.
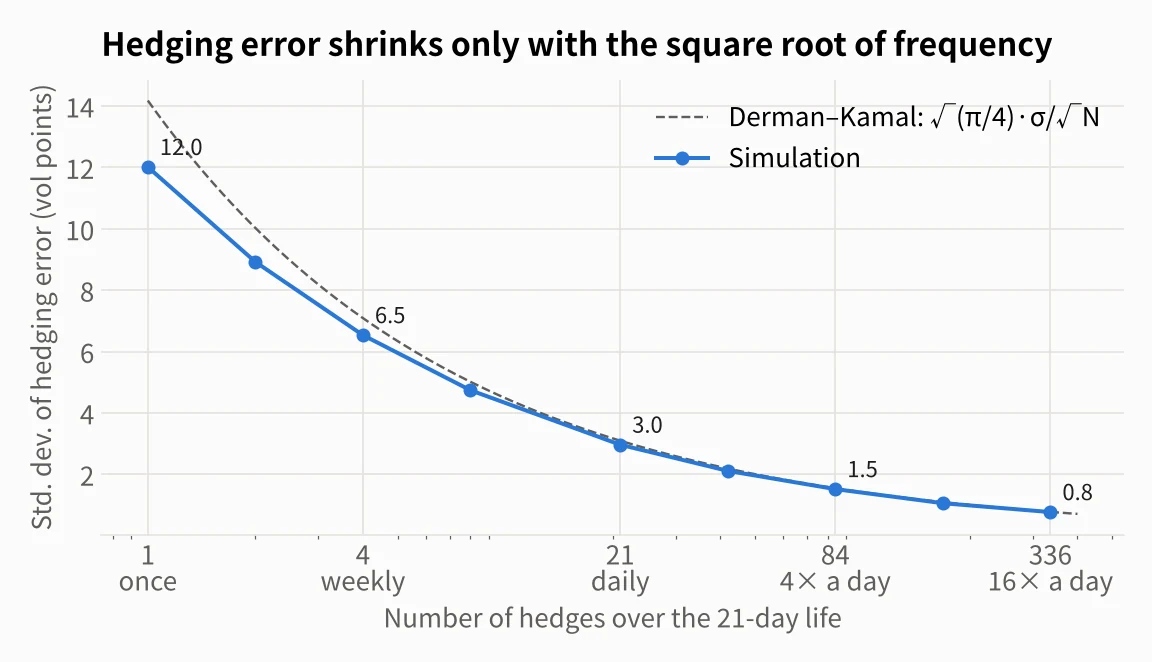
The error shrinks only with the square root of the number of hedges. Hedging once a day for a month leaves about 3 vol points of noise on a 16% option; hedging weekly leaves 6–7, as large as most realistic edges. Getting below 1 point takes a hedge roughly every 20 minutes. Real SPX data agree: hedging the same 6,182 trades every five days instead of daily widened the dispersion around realized minus implied volatility from 4.4 to 6.7 vol points.
More hedging also means more trading costs, so practitioners rarely hedge on a clock. A common approach is a band: rehedge only when delta crosses a threshold, or when the index has moved a set fraction of its expected daily move. Leland (1985) showed that proportional trading costs act like a change in volatility: a long-gamma position behaves as if volatility were bought a little dearer, a short-gamma position as if it were sold a little cheaper, and the adjustment grows with hedging frequency.
6. Which volatility to hedge at
Computing delta requires a volatility. Suppose you bought the option at 15% because you expect the market to realize 20%. The hedge ratio can be computed with either number, and the choice changes the journey, not the expected profit.
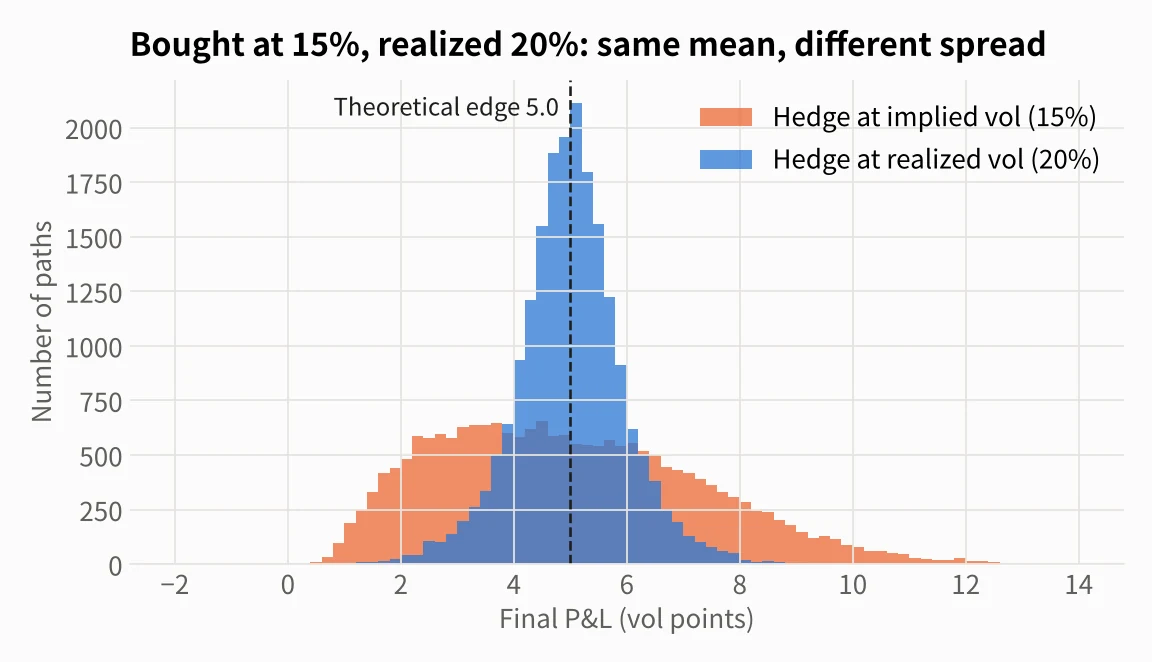
- Hedging at realized volatility (20%) locks in the theoretical edge, about 5 vol points here, almost regardless of the path. The catch is that you must know realized volatility in advance, and the mark-to-market P&L can swing well below zero before it converges at expiry.
- Hedging at implied volatility (15%) gives the same average result with a much wider spread, from near zero to more than 10 points, because the gamma weighting of section 3 decides how much of the edge you capture. In exchange, the P&L accumulates steadily. In continuous time it builds up at ½ · Γ · S² · (σreal² − σimp²) per instant and cannot turn negative while realized volatility stays above implied. In this simulation, no path ended with a loss.
Ahmad and Wilmott (2005) analyze the choice in detail. Most desks hedge at implied volatility, because it is observable in the market and makes daily P&L easy to explain, and accept that the final result depends on the path.
7. Gamma scalping in practice
Put together, a long-gamma trade is not a bet that the market will be generally choppy. It is a bet that the index will move more than the option price implied, often enough to cover theta and costs, while it is still near the strike. In practice that means:
- Know the break-even move. Divide implied volatility by 16 and compare it with the move you expect. If the market prices 0.9% a day and you expect 0.7%, scalping cannot save the trade.
- Recenter when the market runs away. Once the index is far from the strike, the position has little gamma left. Traders who want to keep their volatility exposure roll the strike back to at-the-money and pay the bid-ask spread again.
- Accept small losses and big wins. On SPX, long gamma lost money in about seven months out of ten. The profits come from a few events, and the position has to survive the long quiet stretches in between.
- Short gamma is the mirror image. Selling and hedging options collects premium in most months and gives a large part of it back in a crash. The worst outcomes in the sample for buyers came from buying at the December 2008 volatility peak; the worst for sellers came from selling just before September 2008 and February 2020.
I also checked whether dealer positioning changes the odds. The S&P 500 tends to realize more volatility after days when net gamma exposure (GEX) is negative (see Negative Gamma, Bigger Moves). But implied volatility was already higher on those days (20.4% on average, against 13.8% after positive GEX). Straddles bought after negative GEX lost 0.9 vol points on average and those bought after positive GEX lost 1.2, while the medians ranked the other way. Higher expected volatility is mostly already in the price. GEX is better at describing the regime than at picking winning long-gamma trades.
Key takeaways
- Accounting: a delta-hedged option earns ½ · Γ · S² × (the squared move) each day and pays the same amount × implied variance as theta. It wins on days that move more than implied volatility ÷ 16.
- Path: total P&L tracks realized minus implied volatility (correlation 0.80 on SPX), but weighted by gamma. Moves far from the strike barely count, so explosive months capture only part of the volatility gap.
- Evidence: over 24 years, a 1-month SPX straddle hedged daily lost about 1 vol point on average and won only 31% of the time, with the gains concentrated in 2008, 2020 and April 2025.
- Execution: hedging error falls only with the square root of hedging frequency, and hedging at implied rather than realized volatility smooths the daily P&L at the cost of a path-dependent final result.
Method: Black-Scholes prices and deltas (zero rates and dividends), strike = entry-day close, hedged at every close, settled at the close 21 sessions later, no trading costs or bid-ask spreads (adding them makes the long-volatility results worse). Implied volatility is the site's constant-maturity 1-month ATM estimate. These results describe historical data and simulations and are not investment advice.
References: F. Black, M. Scholes (1973), "The Pricing of Options and Corporate Liabilities," Journal of Political Economy. H. Leland (1985), "Option Pricing and Replication with Transactions Costs," Journal of Finance. E. Derman, M. Kamal (1999), "When You Cannot Hedge Continuously: The Corrections of Black-Scholes," Risk. G. Bakshi, N. Kapadia (2003), "Delta-Hedged Gains and the Negative Market Volatility Risk Premium," Review of Financial Studies. R. Ahmad, P. Wilmott (2005), "Which Free Lunch Would You Like Today, Sir? Delta Hedging, Volatility Arbitrage and Optimal Portfolios," Wilmott Magazine.
Start with Black-Scholes and the Greeks for the model behind every number here. For how fast realized volatility catches up with implied volatility across markets, read How Late Is Realized Volatility?, and for the premium itself across three indices, Variance Risk Premium Across SPX, NDX and RUT.
The Daily Vol is a free email each trading day built from the same data: where dealer gamma sits, what the VIX curve and the SPX vol surface are pricing, and the levels to watch. One click to unsubscribe.