Home › Blog › Quant Research
Variance Risk Premium Across SPX, NDX and RUT, 2002–2026
Index options usually price more volatility than the market then delivers. That gap is the variance risk premium, and it is the main reason option selling has paid over long periods. Most studies measure it on the S&P 500 alone. This article measures it the same way on three US equity indices, the S&P 500, the Nasdaq 100 and the Russell 2000, using 24 years of closing option chains. The questions: how large is the premium, how often did it pay, when does it disappear, and do more volatile indices pay more?
1. What the variance risk premium is
An option price contains a forecast of volatility to expiry: implied volatility. Once the option expires, you can measure the volatility that actually occurred: realized volatility. The variance risk premium is the difference between the two, measured over the same period: implied minus realized. When it is positive, option buyers paid for more movement than they got and sellers kept the difference.
There is a reason for the premium. Volatility rises when stocks fall, so options that pay when volatility spikes are insurance against the moments investors fear most. Buyers accept a small expected loss for that protection, the way homeowners pay more in fire insurance premiums than they collect on average. Sellers are paid for carrying the crash. In the language of Delta Hedging P&L and Gamma Scalping, it is why a delta-hedged long straddle loses a little in most months.
There are two common ways to measure the implied side, and they give different answers.
- At-the-money (ATM) implied volatility: the volatility of options struck at the forward. It is the simplest number on the volatility surface, but it ignores skew.
- Variance-swap rate: the fair price of a contract that pays realized variance. It weights every out-of-the-money option by 1/K², so it includes the expensive downside puts. The VIX is computed this way for the S&P 500, as are the VXN for the Nasdaq 100 and the RVX for the Russell 2000.
Kvar = (2 / T) · Σ (ΔKi / Ki²) · erT · Q(Ki) − (1 / T) · (F / K0 − 1)²
Q(K) is the mid price of the out-of-the-money option at strike K, F the forward, K0 the first strike below the forward and T the time to expiry. Carr and Wu (2009) define the premium as this rate minus the realized variance over the following month, and that is the main measure here. For readability I quote it in vol points, the square root of variance: a premium of 3 means implied volatility was 3 points above the volatility that followed.
2. Data and method
- Dates: 296 start dates, every 21st trading day from February 8, 2002 to October 16, 2026, so the monthly windows do not overlap.
- Implied: for each date and index, the forward comes from put-call parity on the closing option chain; ATM implied volatility and the variance-swap rate are both interpolated to a constant 30 calendar days.
- Realized: close-to-close volatility of the index over the next 21 sessions, annualized.
- Checks: my SPX ATM series has a correlation of 0.999 with the site's own surface fit (0.2 points lower on average), and my SPX variance-swap rate a correlation of 0.997 with the published VIX (0.2 points lower on average).
A few dates with incomplete option chains are left out: one day for the Nasdaq 100, and up to five variance-swap estimates per index where the strike range was too thin.
3. How big is the premium
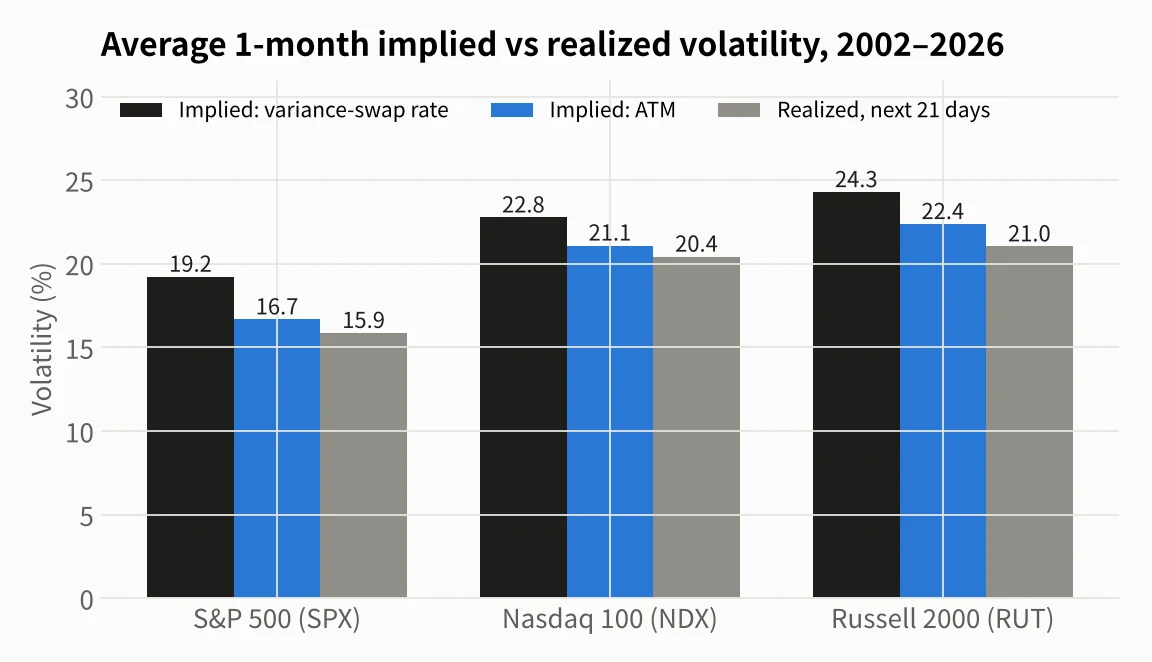
| Monthly windows, 2002–2026 | SPX | NDX | RUT |
|---|---|---|---|
| Average implied, variance-swap rate | 19.2 | 22.8 | 24.3 |
| Average implied, ATM | 16.7 | 21.1 | 22.4 |
| Average realized, next 21 days | 15.9 | 20.4 | 21.0 |
| Variance-swap rate − realized | |||
| Mean (vol points) | 3.5 | 2.5 | 3.3 |
| Median (vol points) | 4.3 | 3.6 | 4.4 |
| Months positive | 81% | 76% | 81% |
| ATM − realized | |||
| Mean (vol points) | 0.8 | 0.7 | 1.3 |
| Median (vol points) | 2.0 | 1.8 | 2.4 |
| Months positive | 70% | 66% | 71% |
| Other | |||
| Skew part: variance-swap rate − ATM | 2.6 | 1.9 | 2.0 |
| Median realized as a share of the variance-swap rate | 75% | 84% | 81% |
Three things stand out.
The premium is positive on all three indices. On the variance-swap measure, implied volatility exceeded realized in roughly four months out of five, by 2.5–3.5 points on average and 3.6–4.4 points at the median.
More volatile does not mean more expensive. Russell 2000 and Nasdaq 100 options cost more in vol points, but they also realize more. Relative to what they deliver, S&P 500 options are the most expensive: in the median month the S&P 500 realized only 75% of its variance-swap rate, against 81% for the Russell 2000 and 84% for the Nasdaq 100.
Most of the premium is in the wings. Measured with ATM volatility alone, the premium shrinks to about 1 point on average and is positive in only two months out of three. The gap between the variance-swap rate and ATM volatility, which comes from skew, is largest for the S&P 500 at 2.6 points. SPX puts are the market's standard hedge, and Gârleanu, Pedersen and Poteshman (2009) showed that persistent demand for index puts that dealers cannot fully hedge pushes their prices up. Someone who sells only at-the-money options collects a much thinner premium than the headline VIX-minus-realized number suggests.
4. Small gains, sudden losses
The 3.5-point average hides how the premium is earned. The chart below adds up the monthly premiums in order, as if one month of variance were sold at the start of each window.
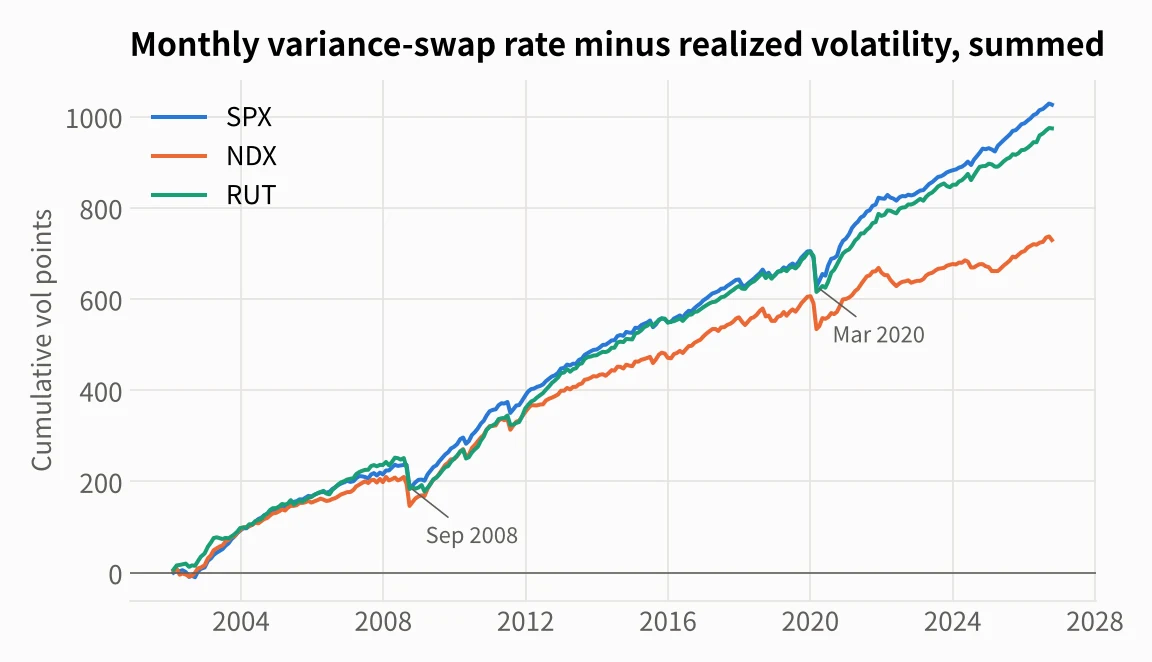
The lines climb steadily and drop in a handful of windows. The worst windows line up across the three indices.
| Start date | SPX | NDX | RUT |
|---|---|---|---|
| March 4, 2020 | −62 | −56 | −79 |
| September 26, 2008 | −49 | −48 | −47 |
| July 28, 2011 | −24 | −23 | −21 |
| Average of the worst 5% of months | −16.8 | −18.9 | −18.8 |
| Average of the other 95% | +4.6 | +3.7 | +4.5 |
For the Russell 2000, August 27, 2008 (−21.3) was marginally worse than July 28, 2011.
Losing months averaged about −6 to −7 points and winning months about +5 to +6. The edge comes not from earning more in a month but from winning three to four times as often. In March 2020 the Russell 2000 realized 110% volatility against a variance-swap rate of 32%, the largest miss in the sample.
Two conclusions follow. First, spreading short volatility across the three indices does not diversify the risk that matters: monthly premiums correlate 0.92 between SPX and NDX, 0.91 between SPX and RUT and 0.85 between NDX and RUT, and the crash months are the same. Second, contracts that pay on variance rather than volatility make the big months bigger. A short variance swap earns (Kvar² − σrealized²) / (2 · Kvar) in vega terms. That averaged 2.1, 1.3 and 2.0 vol points a month for SPX, NDX and RUT, well below the 3.2–3.8 of the median month, and lost 122, 103 and 177 points respectively in the worst month.
5. How the premium has changed
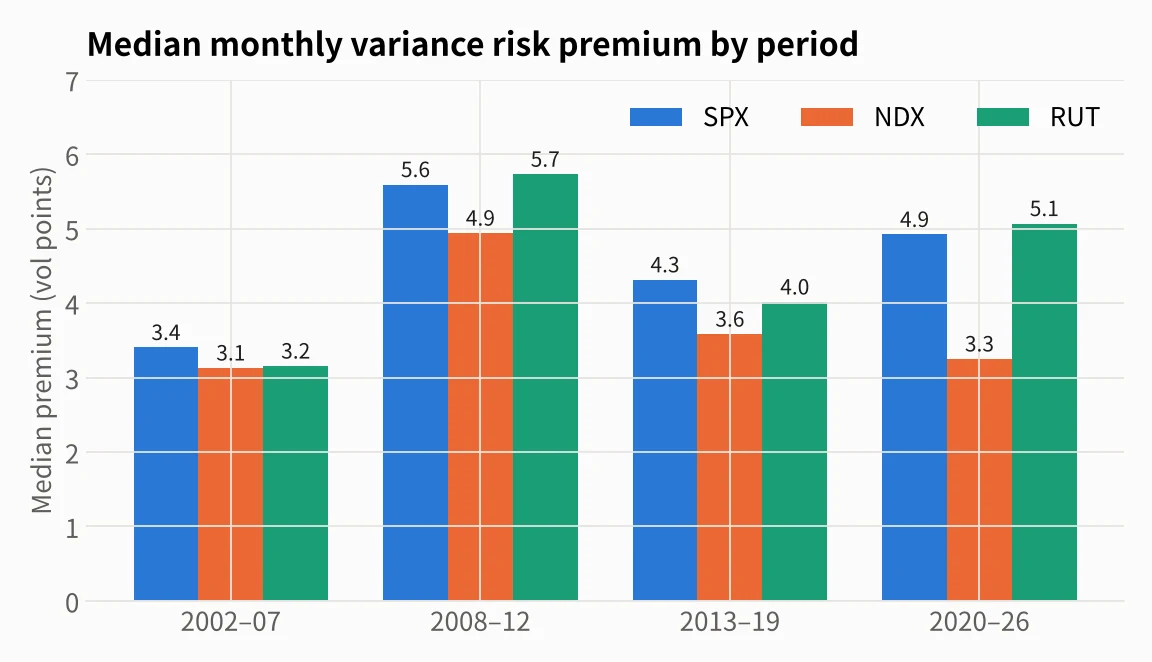
In the typical month, the premium was smallest in 2002–2007, when volatility was low and falling, and largest in 2008–2012, after the financial crisis taught investors to pay up for protection. Since 2020 the S&P 500 and the Russell 2000 have moved back toward that level, with medians of 4.9 and 5.1 points.
The Nasdaq 100 is the exception. Its median premium has stayed around 3.3–3.6 points since 2013, and since 2020 its average has been only 1.6 points, against 3.9 for the S&P 500 and 3.4 for the Russell 2000. Measured with ATM volatility, the Nasdaq 100 premium since 2020 has been slightly negative on average (−0.3). In other words, Nasdaq 100 options have been priced close to fair for the past six years.
6. Relative pricing: priced versus delivered
Another way to compare the indices is to ask how much more volatile than the S&P 500 each one was priced to be, and how much more volatile it turned out to be.
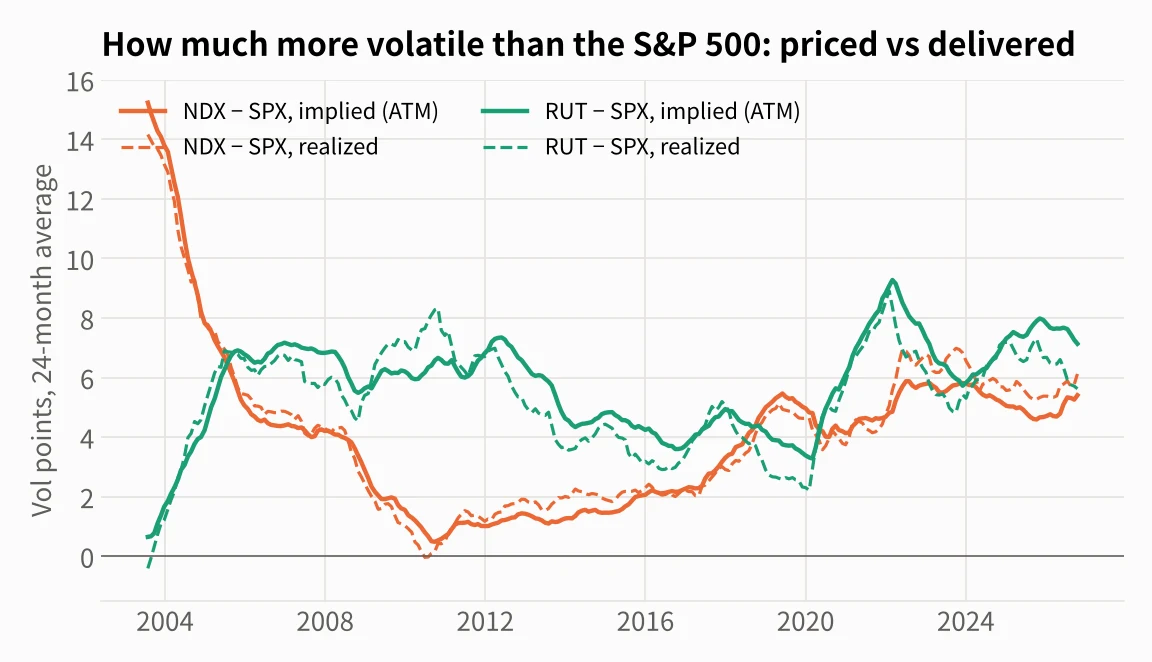
The Nasdaq 100 was priced 4.4 points above the S&P 500 on average and delivered 4.6 points more, with the realized gap exceeding the implied gap in 51% of months. Since 2021 the realized gap has averaged 6.2 points against an implied gap of 5.5, a period in which the index became more concentrated in a few large technology stocks. It is the thin Nasdaq 100 premium of section 5 seen from another angle: relative to the S&P 500, Nasdaq 100 volatility has been priced cheap.
The Russell 2000 is the opposite. It was priced 5.7 points above the S&P 500 and delivered 5.2 points more, with the realized gap larger in only 34% of months. At the money, small-cap volatility has been slightly expensive relative to large caps, although once skew is included the S&P 500 still carries the larger total premium.
7. When is the premium largest
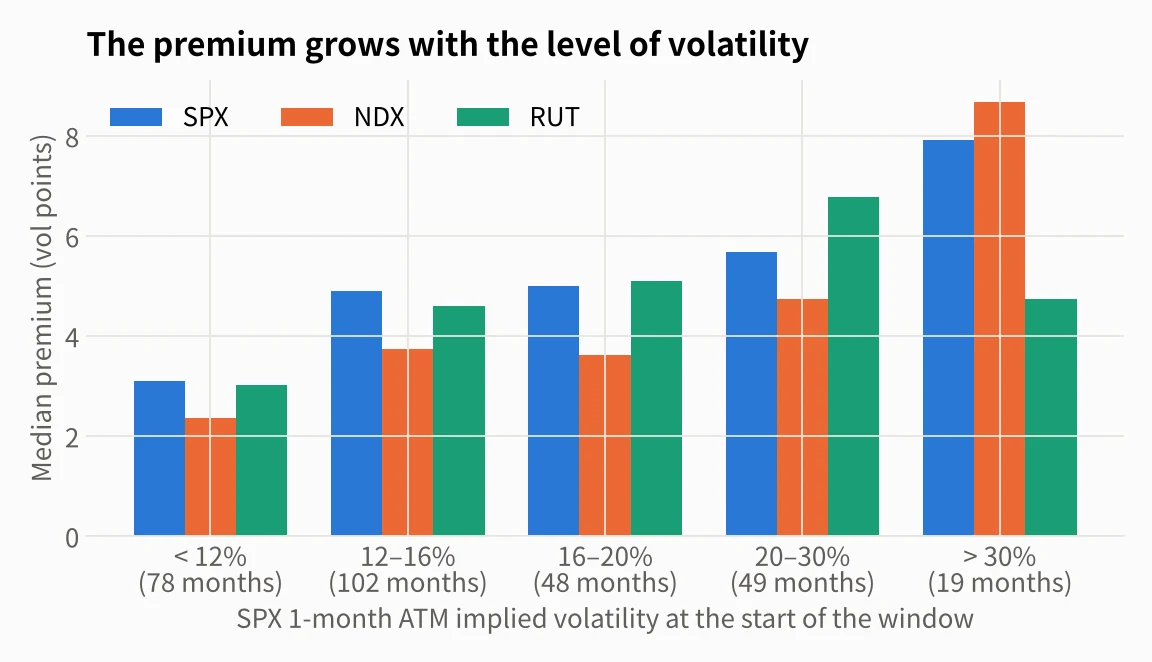
The typical premium grows with the level of volatility. Months that began with SPX implied volatility below 12% had a median S&P 500 premium of 3.1 points; between 12% and 30%, about 5 to 6; above 30%, 7.9 (although only 19 months fall in that bucket). The share of positive months barely changes: 78–83% for the S&P 500 at every level. The larger premium in high volatility comes with larger losses. The 20–30% bucket contains the August 2011 and March 2020 starts, and its average SPX premium is only 3.4 points despite a median of 5.7.
A common shortcut for judging whether options are expensive is to compare implied volatility with the past month's volatility. It helps very little. The gap between the variance-swap rate and the trailing 21-day realized volatility has a correlation of only 0.05–0.09 with the next month's premium on all three indices. Implied volatility above recent realized volatility is the normal state, not a signal in itself. As How Late Is Realized Volatility? shows, realized volatility reacts to shocks with a lag, so the trailing number is a poor guide to the coming month.
8. What it means in practice
- The premium is real and broad. Over 24 years all three indices priced more volatility than they delivered in roughly four months out of five.
- It is payment for crash risk. Gains arrive a little at a time, losses in a few windows that hit all three indices at once. Position size matters more than the choice of index.
- The measure matters. VIX minus realized volatility overstates what an at-the-money seller earns by about 2 to 2.6 points, because a large share of the premium sits in out-of-the-money puts.
- The choice of index changes the details. The S&P 500 has the richest premium relative to realized volatility, mostly from skew. The Russell 2000 pays a similar amount but had the worst single month. The Nasdaq 100 premium has been the thinnest since 2020.
Key takeaways
- Size: the 1-month variance-swap rate exceeded realized volatility by 3.5 (SPX), 3.3 (RUT) and 2.5 (NDX) vol points on average, and did so in 76–81% of months.
- Skew: about 2 to 2.6 points of that premium come from out-of-the-money options. Measured at the money, the premium is only about 1 point.
- Tails: the worst 5% of months averaged −16.8 to −18.9 points on every index, and the three premiums correlate 0.85–0.92.
- Over time: SPX and RUT premiums are back near their post-crisis levels, while NDX options have been priced close to fair since 2020 and NDX volatility has been priced cheap relative to the S&P 500.
Method: 296 non-overlapping start dates, every 21 trading days. Forwards and discount factors from put-call parity near the money; ATM volatility from the Black formula at the two strikes around the forward; variance-swap rate from out-of-the-money mid prices for each expiry (truncated after two consecutive zero bids), both interpolated in total variance to 30 calendar days. Realized volatility is close-to-close over the next 21 sessions, annualized with 252 days. Trading costs are not included. These results describe historical data and are not investment advice.
References: K. Demeterfi, E. Derman, M. Kamal, J. Zou (1999), "More Than You Ever Wanted to Know About Volatility Swaps," Goldman Sachs Quantitative Strategies Research Notes. G. Bakshi, N. Kapadia (2003), "Delta-Hedged Gains and the Negative Market Volatility Risk Premium," Review of Financial Studies. P. Carr, L. Wu (2009), "Variance Risk Premiums," Review of Financial Studies. T. Bollerslev, G. Tauchen, H. Zhou (2009), "Expected Stock Returns and Variance Risk Premia," Review of Financial Studies. N. Gârleanu, L. H. Pedersen, A. Poteshman (2009), "Demand-Based Option Pricing," Review of Financial Studies.
See Delta Hedging P&L and Gamma Scalping for how a hedged option turns this premium into daily P&L, and start with Black-Scholes and the Greeks for why skew makes downside puts expensive.
The Daily Vol is a free email each trading day built from the same data: where dealer gamma sits, what the VIX curve and the SPX vol surface are pricing, and the levels to watch. One click to unsubscribe.